
Advertisement
Warren Buffett famously said, 'Volatility is far from synonymous with risk.' When we think about how risky a company is, we always like to look at its use of debt, since debt overload can lead to ruin. We note that MEKICS CO., Ltd (KOSDAQ:058110) does have debt on its balance sheet. But the more important question is: how much risk is that debt creating?
When Is Debt Dangerous?
Debt assists a business until the business has trouble paying it off, either with new capital or with free cash flow. In the worst case scenario, a company can go bankrupt if it cannot pay its creditors. However, a more common (but still painful) scenario is that it has to raise new equity capital at a low price, thus permanently diluting shareholders. By replacing dilution, though, debt can be an extremely good tool for businesses that need capital to invest in growth at high rates of return. The first thing to do when considering how much debt a business uses is to look at its cash and debt together.
View our latest analysis for MEKICS
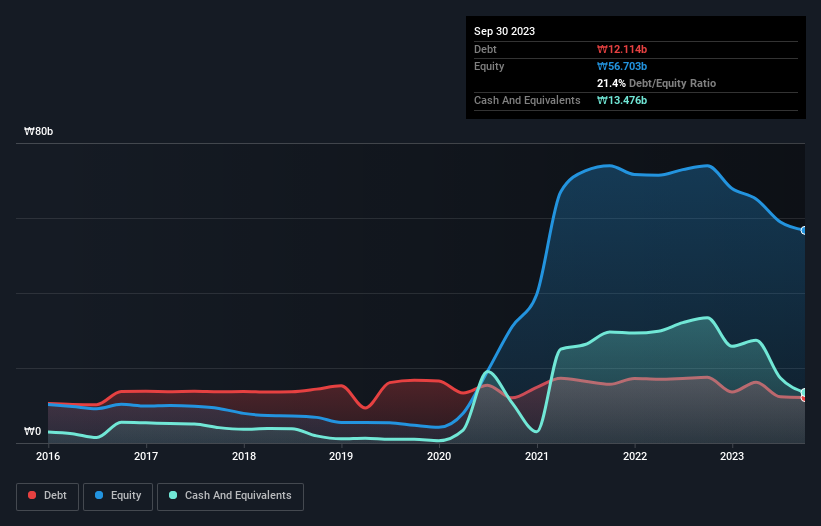
How Much Debt Does MEKICS Carry?
You can click the graphic below for the historical numbers, but it shows that MEKICS had ₩12.1b of debt in September 2023, down from ₩17.5b, one year before. But it also has ₩13.5b in cash to offset that, meaning it has ₩1.36b net cash.
How Healthy Is MEKICS' Balance Sheet?
According to the last reported balance sheet, MEKICS had liabilities of ₩11.7b due within 12 months, and liabilities of ₩4.94b due beyond 12 months. Offsetting these obligations, it had cash of ₩13.5b as well as receivables valued at ₩3.08b due within 12 months. So these liquid assets roughly match the total liabilities.
This state of affairs indicates that MEKICS' balance sheet looks quite solid, as its total liabilities are just about equal to its liquid assets. So it's very unlikely that the ₩49.5b company is short on cash, but still worth keeping an eye on the balance sheet. Despite its noteworthy liabilities, MEKICS boasts net cash, so it's fair to say it does not have a heavy debt load! There's no doubt that we learn most about debt from the balance sheet. But it is MEKICS's earnings that will influence how the balance sheet holds up in the future. So when considering debt, it's definitely worth looking at the earnings trend. Click here for an interactive snapshot.
In the last year MEKICS had a loss before interest and tax, and actually shrunk its revenue by 64%, to ₩12b. That makes us nervous, to say the least.
So How Risky Is MEKICS?
Statistically speaking companies that lose money are riskier than those that make money. And we do note that MEKICS had an earnings before interest and tax (EBIT) loss, over the last year. Indeed, in that time it burnt through ₩12b of cash and made a loss of ₩14b. With only ₩1.36b on the balance sheet, it would appear that its going to need to raise capital again soon. Overall, we'd say the stock is a bit risky, and we're usually very cautious until we see positive free cash flow. When analysing debt levels, the balance sheet is the obvious place to start. But ultimately, every company can contain risks that exist outside of the balance sheet. Case in point: We've spotted 3 warning signs for MEKICS you should be aware of, and 2 of them can't be ignored.
At the end of the day, it's often better to focus on companies that are free from net debt. You can access our special list of such companies (all with a track record of profit growth). It's free.
New: Manage All Your Stock Portfolios in One Place
We've created the ultimate portfolio companion for stock investors, and it's free.
• Connect an unlimited number of Portfolios and see your total in one currency
• Be alerted to new Warning Signs or Risks via email or mobile
• Track the Fair Value of your stocks
Have feedback on this article? Concerned about the content? Get in touch with us directly. Alternatively, email editorial-team (at) simplywallst.com.
This article by Simply Wall St is general in nature. We provide commentary based on historical data and analyst forecasts only using an unbiased methodology and our articles are not intended to be financial advice. It does not constitute a recommendation to buy or sell any stock, and does not take account of your objectives, or your financial situation. We aim to bring you long-term focused analysis driven by fundamental data. Note that our analysis may not factor in the latest price-sensitive company announcements or qualitative material. Simply Wall St has no position in any stocks mentioned.
About KOSDAQ:A058110
Flawless balance sheet with very low risk.
Market Insights

Advertisement
Community Narratives
The company that turned a verb into a global necessity and basically runs the modern internet, digital ads, smartphones, maps, and AI.
Fair Value US$300.00|5.4% undervalued
OS
Community Contributor
Flowers Foods Pays A Fair Price For Health
Fair Value US$16.12|26.3% undervalued
NV
Community Contributor
TMX Group will thrive with 33.3% profit margin and enduring market moat
Fair Value CA$49.90|4.1% overvalued
LI
Community Contributor
The "Molecular Pencil": Why Beam's Technology is Built to Win
Fair Value US$65.01|62.7% undervalued
DA
Community Contributor