
Advertisement
- South Korea
- /
- Food
- /
- KOSDAQ:A195500
These 4 Measures Indicate That Maniker F & G (KOSDAQ:195500) Is Using Debt Reasonably Well
The external fund manager backed by Berkshire Hathaway's Charlie Munger, Li Lu, makes no bones about it when he says 'The biggest investment risk is not the volatility of prices, but whether you will suffer a permanent loss of capital.' When we think about how risky a company is, we always like to look at its use of debt, since debt overload can lead to ruin. As with many other companies Maniker F & G Co., Ltd. (KOSDAQ:195500) makes use of debt. But is this debt a concern to shareholders?
Why Does Debt Bring Risk?
Debt and other liabilities become risky for a business when it cannot easily fulfill those obligations, either with free cash flow or by raising capital at an attractive price. Ultimately, if the company can't fulfill its legal obligations to repay debt, shareholders could walk away with nothing. However, a more usual (but still expensive) situation is where a company must dilute shareholders at a cheap share price simply to get debt under control. Of course, the upside of debt is that it often represents cheap capital, especially when it replaces dilution in a company with the ability to reinvest at high rates of return. When we examine debt levels, we first consider both cash and debt levels, together.
See our latest analysis for Maniker F & G
What Is Maniker F & G's Debt?
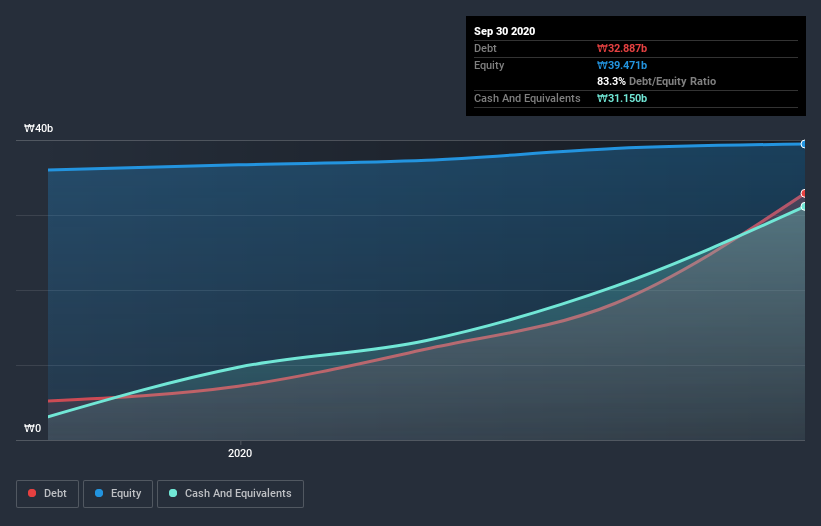
The image below, which you can click on for greater detail, shows that at September 2020 Maniker F & G had debt of ₩32.9b, up from ₩5.21b in one year. However, because it has a cash reserve of ₩31.1b, its net debt is less, at about ₩1.74b.
A Look At Maniker F & G's Liabilities
According to the last reported balance sheet, Maniker F & G had liabilities of ₩27.3b due within 12 months, and liabilities of ₩21.0b due beyond 12 months. Offsetting these obligations, it had cash of ₩31.1b as well as receivables valued at ₩16.0b due within 12 months. So its liabilities outweigh the sum of its cash and (near-term) receivables by ₩1.22b.
This state of affairs indicates that Maniker F & G's balance sheet looks quite solid, as its total liabilities are just about equal to its liquid assets. So it's very unlikely that the ₩88.2b company is short on cash, but still worth keeping an eye on the balance sheet.
We measure a company's debt load relative to its earnings power by looking at its net debt divided by its earnings before interest, tax, depreciation, and amortization (EBITDA) and by calculating how easily its earnings before interest and tax (EBIT) cover its interest expense (interest cover). Thus we consider debt relative to earnings both with and without depreciation and amortization expenses.
Maniker F & G has a low net debt to EBITDA ratio of only 0.26. And its EBIT covers its interest expense a whopping 11.0 times over. So we're pretty relaxed about its super-conservative use of debt. But the bad news is that Maniker F & G has seen its EBIT plunge 12% in the last twelve months. We think hat kind of performance, if repeated frequently, could well lead to difficulties for the stock. There's no doubt that we learn most about debt from the balance sheet. But it is Maniker F & G's earnings that will influence how the balance sheet holds up in the future. So if you're keen to discover more about its earnings, it might be worth checking out this graph of its long term earnings trend.
But our final consideration is also important, because a company cannot pay debt with paper profits; it needs cold hard cash. So the logical step is to look at the proportion of that EBIT that is matched by actual free cash flow. Over the most recent two years, Maniker F & G recorded free cash flow worth 71% of its EBIT, which is around normal, given free cash flow excludes interest and tax. This cold hard cash means it can reduce its debt when it wants to.
Our View
The good news is that Maniker F & G's demonstrated ability handle its debt, based on its EBITDA, delights us like a fluffy puppy does a toddler. But we must concede we find its EBIT growth rate has the opposite effect. When we consider the range of factors above, it looks like Maniker F & G is pretty sensible with its use of debt. That means they are taking on a bit more risk, in the hope of boosting shareholder returns. There's no doubt that we learn most about debt from the balance sheet. However, not all investment risk resides within the balance sheet - far from it. Be aware that Maniker F & G is showing 4 warning signs in our investment analysis , you should know about...
At the end of the day, it's often better to focus on companies that are free from net debt. You can access our special list of such companies (all with a track record of profit growth). It's free.
If you decide to trade Maniker F & G, use the lowest-cost* platform that is rated #1 Overall by Barron’s, Interactive Brokers. Trade stocks, options, futures, forex, bonds and funds on 135 markets, all from a single integrated account. Promoted
New: Manage All Your Stock Portfolios in One Place
We've created the ultimate portfolio companion for stock investors, and it's free.
• Connect an unlimited number of Portfolios and see your total in one currency
• Be alerted to new Warning Signs or Risks via email or mobile
• Track the Fair Value of your stocks
This article by Simply Wall St is general in nature. It does not constitute a recommendation to buy or sell any stock, and does not take account of your objectives, or your financial situation. We aim to bring you long-term focused analysis driven by fundamental data. Note that our analysis may not factor in the latest price-sensitive company announcements or qualitative material. Simply Wall St has no position in any stocks mentioned.
*Interactive Brokers Rated Lowest Cost Broker by StockBrokers.com Annual Online Review 2020
Have feedback on this article? Concerned about the content? Get in touch with us directly. Alternatively, email editorial-team (at) simplywallst.com.
About KOSDAQ:A195500
Maniker F&G
Engages in the production and sale of various frozen, chilled, and retorted chicken and meat products for family and business use.
Excellent balance sheet with low risk.
Market Insights

Advertisement
Community Narratives
MicroVision will explode future revenue by 380.37% with a vision towards success
Fair Value US$60.00|98.5% undervalued
TH
Community Contributor
The Indispensable Artery for a New North American Economy
Fair Value CA$132.87|2.3% undervalued
TI
Community Contributor