- South Korea
- /
- Beverage
- /
- KOSDAQ:A043650
Introducing Kook Soon Dang.Co.Ltd (KOSDAQ:043650), A Stock That Climbed 70% In The Last Year
Passive investing in index funds can generate returns that roughly match the overall market. But if you pick the right individual stocks, you could make more than that. To wit, the Kook Soon Dang.Co.,Ltd. (KOSDAQ:043650) share price is 70% higher than it was a year ago, much better than the market return of around 40% (not including dividends) in the same period. That's a solid performance by our standards! In contrast, the longer term returns are negative, since the share price is 6.3% lower than it was three years ago.
View our latest analysis for Kook Soon Dang.Co.Ltd
To paraphrase Benjamin Graham: Over the short term the market is a voting machine, but over the long term it's a weighing machine. One imperfect but simple way to consider how the market perception of a company has shifted is to compare the change in the earnings per share (EPS) with the share price movement.
During the last year Kook Soon Dang.Co.Ltd grew its earnings per share, moving from a loss to a profit.
When a company has just transitioned to profitability, earnings per share growth is not always the best way to look at the share price action.
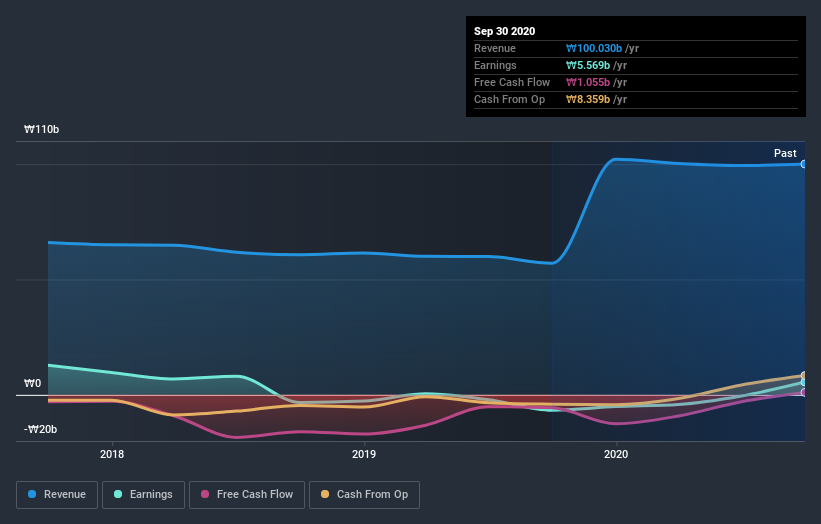
We doubt the modest 1.8% dividend yield is doing much to support the share price. We think that the revenue growth of 74% could have some investors interested. Many businesses do go through a phase where they have to forgo some profits to drive business development, and sometimes its for the best.
The image below shows how earnings and revenue have tracked over time (if you click on the image you can see greater detail).

If you are thinking of buying or selling Kook Soon Dang.Co.Ltd stock, you should check out this FREE detailed report on its balance sheet.
What About Dividends?
It is important to consider the total shareholder return, as well as the share price return, for any given stock. The TSR is a return calculation that accounts for the value of cash dividends (assuming that any dividend received was reinvested) and the calculated value of any discounted capital raisings and spin-offs. It's fair to say that the TSR gives a more complete picture for stocks that pay a dividend. In the case of Kook Soon Dang.Co.Ltd, it has a TSR of 73% for the last year. That exceeds its share price return that we previously mentioned. And there's no prize for guessing that the dividend payments largely explain the divergence!
A Different Perspective
We're pleased to report that Kook Soon Dang.Co.Ltd shareholders have received a total shareholder return of 73% over one year. And that does include the dividend. Notably the five-year annualised TSR loss of 1.6% per year compares very unfavourably with the recent share price performance. This makes us a little wary, but the business might have turned around its fortunes. I find it very interesting to look at share price over the long term as a proxy for business performance. But to truly gain insight, we need to consider other information, too. To that end, you should be aware of the 3 warning signs we've spotted with Kook Soon Dang.Co.Ltd .
Of course, you might find a fantastic investment by looking elsewhere. So take a peek at this free list of companies we expect will grow earnings.
Please note, the market returns quoted in this article reflect the market weighted average returns of stocks that currently trade on KR exchanges.
If you decide to trade Kook Soon Dang.Co.Ltd, use the lowest-cost* platform that is rated #1 Overall by Barron’s, Interactive Brokers. Trade stocks, options, futures, forex, bonds and funds on 135 markets, all from a single integrated account. Promoted
Valuation is complex, but we're here to simplify it.
Discover if Kook Soon Dang.Co.Ltd might be undervalued or overvalued with our detailed analysis, featuring fair value estimates, potential risks, dividends, insider trades, and its financial condition.
Access Free AnalysisThis article by Simply Wall St is general in nature. It does not constitute a recommendation to buy or sell any stock, and does not take account of your objectives, or your financial situation. We aim to bring you long-term focused analysis driven by fundamental data. Note that our analysis may not factor in the latest price-sensitive company announcements or qualitative material. Simply Wall St has no position in any stocks mentioned.
*Interactive Brokers Rated Lowest Cost Broker by StockBrokers.com Annual Online Review 2020
Have feedback on this article? Concerned about the content? Get in touch with us directly. Alternatively, email editorial-team (at) simplywallst.com.
About KOSDAQ:A043650
Kook Soon Dang.Co.Ltd
Produces and sells Korean wine and health-related products worldwide.
Flawless balance sheet with moderate risk.
Market Insights
Community Narratives


