
Advertisement
- South Korea
- /
- Oil and Gas
- /
- KOSE:A012320
Does Kyungdong Invest's (KRX:012320) Returns On Capital Reflect Well On The Business?
When it comes to investing, there are some useful financial metrics that can warn us when a business is potentially in trouble. Businesses in decline often have two underlying trends, firstly, a declining return on capital employed (ROCE) and a declining base of capital employed. Basically the company is earning less on its investments and it is also reducing its total assets. So after glancing at the trends within Kyungdong Invest (KRX:012320), we weren't too hopeful.
Understanding Return On Capital Employed (ROCE)
For those that aren't sure what ROCE is, it measures the amount of pre-tax profits a company can generate from the capital employed in its business. The formula for this calculation on Kyungdong Invest is:
Return on Capital Employed = Earnings Before Interest and Tax (EBIT) ÷ (Total Assets - Current Liabilities)
0.023 = ₩12b ÷ (₩595b - ₩71b) (Based on the trailing twelve months to September 2020).
Thus, Kyungdong Invest has an ROCE of 2.3%. Ultimately, that's a low return and it under-performs the Oil and Gas industry average of 5.5%.
See our latest analysis for Kyungdong Invest
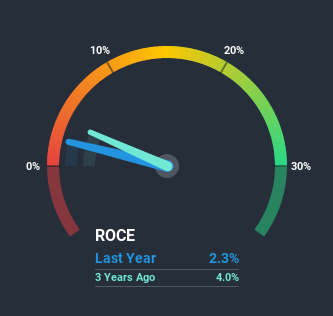
While the past is not representative of the future, it can be helpful to know how a company has performed historically, which is why we have this chart above. If you're interested in investigating Kyungdong Invest's past further, check out this free graph of past earnings, revenue and cash flow.
What Can We Tell From Kyungdong Invest's ROCE Trend?
The trend of ROCE at Kyungdong Invest is showing some signs of weakness. The company used to generate 3.5% on its capital five years ago but it has since fallen noticeably. In addition to that, Kyungdong Invest is now employing 37% less capital than it was five years ago. The fact that both are shrinking is an indication that the business is going through some tough times. If these underlying trends continue, we wouldn't be too optimistic going forward.
On a related note, Kyungdong Invest has decreased its current liabilities to 12% of total assets. So we could link some of this to the decrease in ROCE. Effectively this means their suppliers or short-term creditors are funding less of the business, which reduces some elements of risk. Since the business is basically funding more of its operations with it's own money, you could argue this has made the business less efficient at generating ROCE.
The Bottom Line On Kyungdong Invest's ROCE
In short, lower returns and decreasing amounts capital employed in the business doesn't fill us with confidence. It should come as no surprise then that the stock has fallen 36% over the last five years, so it looks like investors are recognizing these changes. With underlying trends that aren't great in these areas, we'd consider looking elsewhere.
One more thing: We've identified 3 warning signs with Kyungdong Invest (at least 1 which can't be ignored) , and understanding these would certainly be useful.
If you want to search for solid companies with great earnings, check out this free list of companies with good balance sheets and impressive returns on equity.
If you’re looking to trade Kyungdong Invest, open an account with the lowest-cost* platform trusted by professionals, Interactive Brokers. Their clients from over 200 countries and territories trade stocks, options, futures, forex, bonds and funds worldwide from a single integrated account. Promoted
Valuation is complex, but we're here to simplify it.
Discover if Kyungdong Invest might be undervalued or overvalued with our detailed analysis, featuring fair value estimates, potential risks, dividends, insider trades, and its financial condition.
Access Free AnalysisThis article by Simply Wall St is general in nature. It does not constitute a recommendation to buy or sell any stock, and does not take account of your objectives, or your financial situation. We aim to bring you long-term focused analysis driven by fundamental data. Note that our analysis may not factor in the latest price-sensitive company announcements or qualitative material. Simply Wall St has no position in any stocks mentioned.
*Interactive Brokers Rated Lowest Cost Broker by StockBrokers.com Annual Online Review 2020
Have feedback on this article? Concerned about the content? Get in touch with us directly. Alternatively, email editorial-team (at) simplywallst.com.
About KOSE:A012320
Kyungdong Invest
Primarily engages in the supply of city gas in South Korea.
Flawless balance sheet with solid track record.
Market Insights

Advertisement
Community Narratives
MicroVision will explode future revenue by 380.37% with a vision towards success
Fair Value US$60.00|98.5% undervalued
TH
Community Contributor
The Indispensable Artery for a New North American Economy
Fair Value CA$132.87|2.3% undervalued
TI
Community Contributor