
Advertisement
- South Korea
- /
- Hospitality
- /
- KOSDAQ:A006730
Seobu T&D (KOSDAQ:006730) Use Of Debt Could Be Considered Risky
Some say volatility, rather than debt, is the best way to think about risk as an investor, but Warren Buffett famously said that 'Volatility is far from synonymous with risk.' It's only natural to consider a company's balance sheet when you examine how risky it is, since debt is often involved when a business collapses. We can see that Seobu T&D Co., Ltd. (KOSDAQ:006730) does use debt in its business. But the real question is whether this debt is making the company risky.
Why Does Debt Bring Risk?
Debt is a tool to help businesses grow, but if a business is incapable of paying off its lenders, then it exists at their mercy. Ultimately, if the company can't fulfill its legal obligations to repay debt, shareholders could walk away with nothing. However, a more frequent (but still costly) occurrence is where a company must issue shares at bargain-basement prices, permanently diluting shareholders, just to shore up its balance sheet. By replacing dilution, though, debt can be an extremely good tool for businesses that need capital to invest in growth at high rates of return. The first step when considering a company's debt levels is to consider its cash and debt together.
What Is Seobu T&D's Debt?
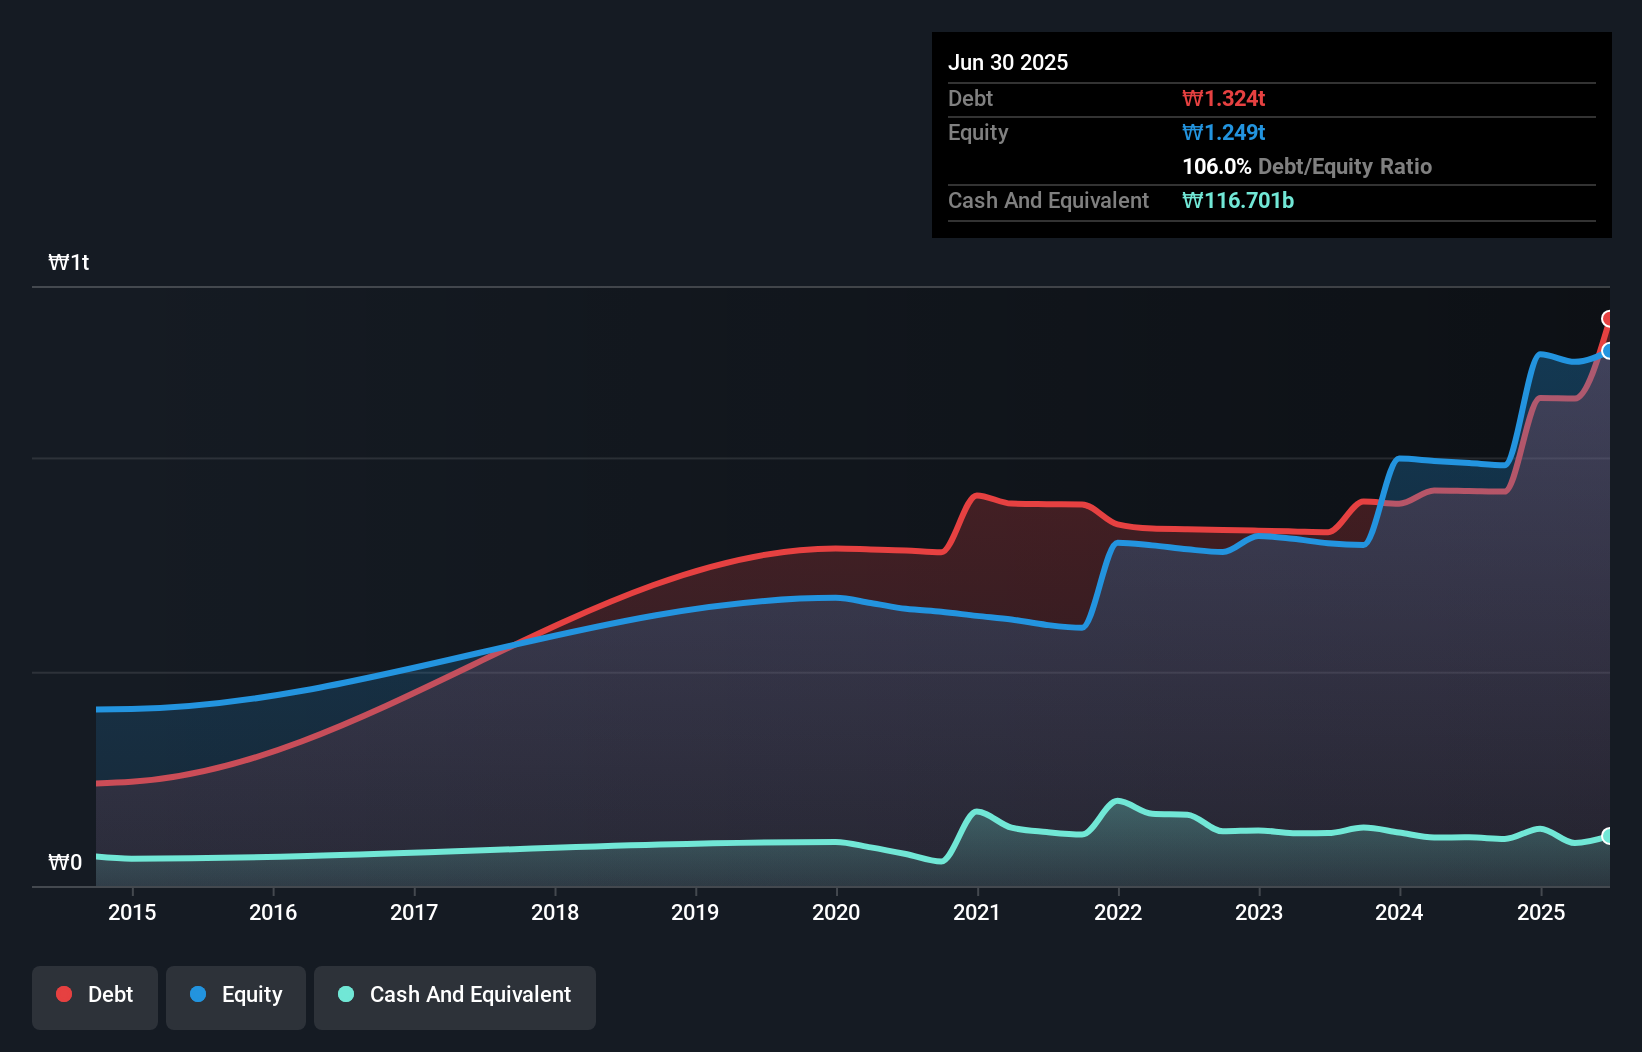
The image below, which you can click on for greater detail, shows that at June 2025 Seobu T&D had debt of ₩1.32t, up from ₩921.6b in one year. However, because it has a cash reserve of ₩116.7b, its net debt is less, at about ₩1.21t.
How Strong Is Seobu T&D's Balance Sheet?
According to the last reported balance sheet, Seobu T&D had liabilities of ₩654.1b due within 12 months, and liabilities of ₩1.12t due beyond 12 months. Offsetting this, it had ₩116.7b in cash and ₩11.4b in receivables that were due within 12 months. So its liabilities total ₩1.65t more than the combination of its cash and short-term receivables.
This deficit casts a shadow over the ₩673.1b company, like a colossus towering over mere mortals. So we'd watch its balance sheet closely, without a doubt. At the end of the day, Seobu T&D would probably need a major re-capitalization if its creditors were to demand repayment.
See our latest analysis for Seobu T&D
We use two main ratios to inform us about debt levels relative to earnings. The first is net debt divided by earnings before interest, tax, depreciation, and amortization (EBITDA), while the second is how many times its earnings before interest and tax (EBIT) covers its interest expense (or its interest cover, for short). The advantage of this approach is that we take into account both the absolute quantum of debt (with net debt to EBITDA) and the actual interest expenses associated with that debt (with its interest cover ratio).
Seobu T&D shareholders face the double whammy of a high net debt to EBITDA ratio (17.3), and fairly weak interest coverage, since EBIT is just 0.97 times the interest expense. The debt burden here is substantial. However, one redeeming factor is that Seobu T&D grew its EBIT at 16% over the last 12 months, boosting its ability to handle its debt. There's no doubt that we learn most about debt from the balance sheet. But ultimately the future profitability of the business will decide if Seobu T&D can strengthen its balance sheet over time. So if you're focused on the future you can check out this free report showing analyst profit forecasts.
Finally, a business needs free cash flow to pay off debt; accounting profits just don't cut it. So the logical step is to look at the proportion of that EBIT that is matched by actual free cash flow. During the last three years, Seobu T&D burned a lot of cash. While that may be a result of expenditure for growth, it does make the debt far more risky.
Our View
To be frank both Seobu T&D's conversion of EBIT to free cash flow and its track record of staying on top of its total liabilities make us rather uncomfortable with its debt levels. But on the bright side, its EBIT growth rate is a good sign, and makes us more optimistic. Taking into account all the aforementioned factors, it looks like Seobu T&D has too much debt. That sort of riskiness is ok for some, but it certainly doesn't float our boat. When analysing debt levels, the balance sheet is the obvious place to start. But ultimately, every company can contain risks that exist outside of the balance sheet. Be aware that Seobu T&D is showing 5 warning signs in our investment analysis , and 2 of those make us uncomfortable...
If you're interested in investing in businesses that can grow profits without the burden of debt, then check out this free list of growing businesses that have net cash on the balance sheet.
New: Manage All Your Stock Portfolios in One Place
We've created the ultimate portfolio companion for stock investors, and it's free.
• Connect an unlimited number of Portfolios and see your total in one currency
• Be alerted to new Warning Signs or Risks via email or mobile
• Track the Fair Value of your stocks
Have feedback on this article? Concerned about the content? Get in touch with us directly. Alternatively, email editorial-team (at) simplywallst.com.
This article by Simply Wall St is general in nature. We provide commentary based on historical data and analyst forecasts only using an unbiased methodology and our articles are not intended to be financial advice. It does not constitute a recommendation to buy or sell any stock, and does not take account of your objectives, or your financial situation. We aim to bring you long-term focused analysis driven by fundamental data. Note that our analysis may not factor in the latest price-sensitive company announcements or qualitative material. Simply Wall St has no position in any stocks mentioned.
About KOSDAQ:A006730
Moderate risk and slightly overvalued.
Market Insights

Advertisement
Community Narratives
MicroVision will explode future revenue by 380.37% with a vision towards success
Fair Value US$60.00|98.5% undervalued
TH
Community Contributor
The Indispensable Artery for a New North American Economy
Fair Value CA$132.87|2.3% undervalued
TI
Community Contributor