Stock Analysis
- South Korea
- /
- Food and Staples Retail
- /
- KOSE:A007070
The five-year shareholder returns and company earnings persist lower as GS Retail (KRX:007070) stock falls a further 3.7% in past week
The main aim of stock picking is to find the market-beating stocks. But in any portfolio, there will be mixed results between individual stocks. So we wouldn't blame long term GS Retail Co., Ltd. (KRX:007070) shareholders for doubting their decision to hold, with the stock down 46% over a half decade. And some of the more recent buyers are probably worried, too, with the stock falling 25% in the last year. Furthermore, it's down 13% in about a quarter. That's not much fun for holders. This could be related to the recent financial results - you can catch up on the most recent data by reading our company report.
After losing 3.7% this past week, it's worth investigating the company's fundamentals to see what we can infer from past performance.
See our latest analysis for GS Retail
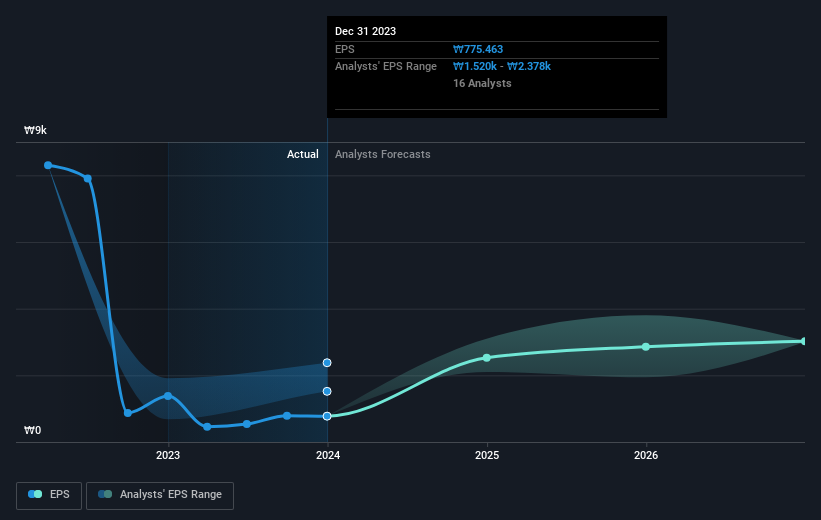
While markets are a powerful pricing mechanism, share prices reflect investor sentiment, not just underlying business performance. One way to examine how market sentiment has changed over time is to look at the interaction between a company's share price and its earnings per share (EPS).
Looking back five years, both GS Retail's share price and EPS declined; the latter at a rate of 13% per year. This change in EPS is reasonably close to the 12% average annual decrease in the share price. That suggests that the market sentiment around the company hasn't changed much over that time. Rather, the share price has approximately tracked EPS growth.
The image below shows how EPS has tracked over time (if you click on the image you can see greater detail).
Before buying or selling a stock, we always recommend a close examination of historic growth trends, available here.
What About Dividends?
As well as measuring the share price return, investors should also consider the total shareholder return (TSR). The TSR is a return calculation that accounts for the value of cash dividends (assuming that any dividend received was reinvested) and the calculated value of any discounted capital raisings and spin-offs. It's fair to say that the TSR gives a more complete picture for stocks that pay a dividend. As it happens, GS Retail's TSR for the last 5 years was -39%, which exceeds the share price return mentioned earlier. The dividends paid by the company have thusly boosted the total shareholder return.
A Different Perspective
Investors in GS Retail had a tough year, with a total loss of 24% (including dividends), against a market gain of about 15%. However, keep in mind that even the best stocks will sometimes underperform the market over a twelve month period. Unfortunately, last year's performance may indicate unresolved challenges, given that it was worse than the annualised loss of 7% over the last half decade. We realise that Baron Rothschild has said investors should "buy when there is blood on the streets", but we caution that investors should first be sure they are buying a high quality business. I find it very interesting to look at share price over the long term as a proxy for business performance. But to truly gain insight, we need to consider other information, too. Consider risks, for instance. Every company has them, and we've spotted 3 warning signs for GS Retail you should know about.
If you would prefer to check out another company -- one with potentially superior financials -- then do not miss this free list of companies that have proven they can grow earnings.
Please note, the market returns quoted in this article reflect the market weighted average returns of stocks that currently trade on South Korean exchanges.
Valuation is complex, but we're helping make it simple.
Find out whether GS Retail is potentially over or undervalued by checking out our comprehensive analysis, which includes fair value estimates, risks and warnings, dividends, insider transactions and financial health.
View the Free AnalysisHave feedback on this article? Concerned about the content? Get in touch with us directly. Alternatively, email editorial-team (at) simplywallst.com.
This article by Simply Wall St is general in nature. We provide commentary based on historical data and analyst forecasts only using an unbiased methodology and our articles are not intended to be financial advice. It does not constitute a recommendation to buy or sell any stock, and does not take account of your objectives, or your financial situation. We aim to bring you long-term focused analysis driven by fundamental data. Note that our analysis may not factor in the latest price-sensitive company announcements or qualitative material. Simply Wall St has no position in any stocks mentioned.
About KOSE:A007070
GS Retail
GS Retail Co., Ltd. engages in retailing business in South Korea.
Adequate balance sheet and fair value.

