
Advertisement
- South Korea
- /
- Professional Services
- /
- KOSDAQ:A187220
The Market Doesn't Like What It Sees From DT&C.Co.,Ltd's (KOSDAQ:187220) Revenues Yet As Shares Tumble 29%
Unfortunately for some shareholders, the DT&C.Co.,Ltd (KOSDAQ:187220) share price has dived 29% in the last thirty days, prolonging recent pain. The drop over the last 30 days has capped off a tough year for shareholders, with the share price down 12% in that time.
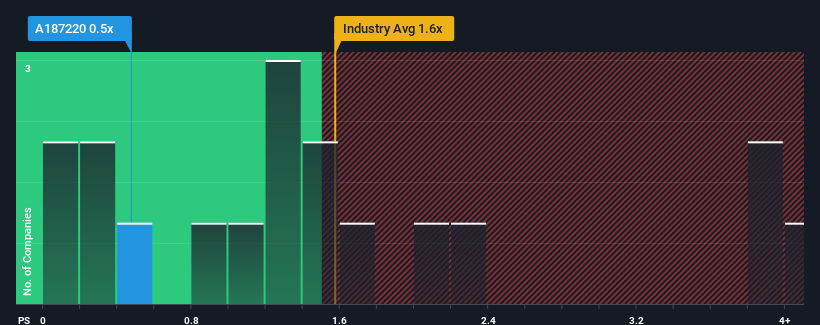
Since its price has dipped substantially, given about half the companies operating in Korea's Professional Services industry have price-to-sales ratios (or "P/S") above 1.4x, you may consider DT&C.Co.Ltd as an attractive investment with its 0.5x P/S ratio. Nonetheless, we'd need to dig a little deeper to determine if there is a rational basis for the reduced P/S.
Check out our latest analysis for DT&C.Co.Ltd
What Does DT&C.Co.Ltd's P/S Mean For Shareholders?
For example, consider that DT&C.Co.Ltd's financial performance has been poor lately as its revenue has been in decline. One possibility is that the P/S is low because investors think the company won't do enough to avoid underperforming the broader industry in the near future. Those who are bullish on DT&C.Co.Ltd will be hoping that this isn't the case so that they can pick up the stock at a lower valuation.
Although there are no analyst estimates available for DT&C.Co.Ltd, take a look at this free data-rich visualisation to see how the company stacks up on earnings, revenue and cash flow.Is There Any Revenue Growth Forecasted For DT&C.Co.Ltd?
The only time you'd be truly comfortable seeing a P/S as low as DT&C.Co.Ltd's is when the company's growth is on track to lag the industry.
Retrospectively, the last year delivered a frustrating 12% decrease to the company's top line. Regardless, revenue has managed to lift by a handy 15% in aggregate from three years ago, thanks to the earlier period of growth. Although it's been a bumpy ride, it's still fair to say the revenue growth recently has been mostly respectable for the company.
Comparing that to the industry, which is predicted to deliver 16% growth in the next 12 months, the company's momentum is weaker, based on recent medium-term annualised revenue results.
In light of this, it's understandable that DT&C.Co.Ltd's P/S sits below the majority of other companies. It seems most investors are expecting to see the recent limited growth rates continue into the future and are only willing to pay a reduced amount for the stock.
What Does DT&C.Co.Ltd's P/S Mean For Investors?
The southerly movements of DT&C.Co.Ltd's shares means its P/S is now sitting at a pretty low level. Typically, we'd caution against reading too much into price-to-sales ratios when settling on investment decisions, though it can reveal plenty about what other market participants think about the company.
Our examination of DT&C.Co.Ltd confirms that the company's revenue trends over the past three-year years are a key factor in its low price-to-sales ratio, as we suspected, given they fall short of current industry expectations. Right now shareholders are accepting the low P/S as they concede future revenue probably won't provide any pleasant surprises. Unless the recent medium-term conditions improve, they will continue to form a barrier for the share price around these levels.
It's always necessary to consider the ever-present spectre of investment risk. We've identified 3 warning signs with DT&C.Co.Ltd (at least 1 which shouldn't be ignored), and understanding them should be part of your investment process.
It's important to make sure you look for a great company, not just the first idea you come across. So if growing profitability aligns with your idea of a great company, take a peek at this free list of interesting companies with strong recent earnings growth (and a low P/E).
New: Manage All Your Stock Portfolios in One Place
We've created the ultimate portfolio companion for stock investors, and it's free.
• Connect an unlimited number of Portfolios and see your total in one currency
• Be alerted to new Warning Signs or Risks via email or mobile
• Track the Fair Value of your stocks
Have feedback on this article? Concerned about the content? Get in touch with us directly. Alternatively, email editorial-team (at) simplywallst.com.
This article by Simply Wall St is general in nature. We provide commentary based on historical data and analyst forecasts only using an unbiased methodology and our articles are not intended to be financial advice. It does not constitute a recommendation to buy or sell any stock, and does not take account of your objectives, or your financial situation. We aim to bring you long-term focused analysis driven by fundamental data. Note that our analysis may not factor in the latest price-sensitive company announcements or qualitative material. Simply Wall St has no position in any stocks mentioned.
About KOSDAQ:A187220
Low risk and slightly overvalued.
Market Insights

Advertisement
Community Narratives
MicroVision will explode future revenue by 380.37% with a vision towards success
Fair Value US$60.00|98.5% undervalued
TH
Community Contributor
The Indispensable Artery for a New North American Economy
Fair Value CA$132.87|2.3% undervalued
TI
Community Contributor