
Advertisement
- South Korea
- /
- Machinery
- /
- KOSE:A064350
Estimating The Intrinsic Value Of Hyundai Rotem Company (KRX:064350)
Key Insights
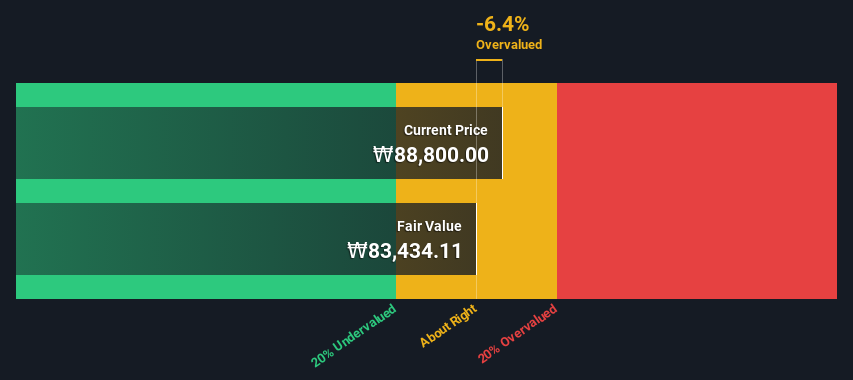
- Using the 2 Stage Free Cash Flow to Equity, Hyundai Rotem fair value estimate is ₩83,434
- With ₩88,800 share price, Hyundai Rotem appears to be trading close to its estimated fair value
- Our fair value estimate is 15% lower than Hyundai Rotem's analyst price target of ₩98,250
How far off is Hyundai Rotem Company (KRX:064350) from its intrinsic value? Using the most recent financial data, we'll take a look at whether the stock is fairly priced by taking the expected future cash flows and discounting them to their present value. We will use the Discounted Cash Flow (DCF) model on this occasion. There's really not all that much to it, even though it might appear quite complex.
Companies can be valued in a lot of ways, so we would point out that a DCF is not perfect for every situation. Anyone interested in learning a bit more about intrinsic value should have a read of the Simply Wall St analysis model.
See our latest analysis for Hyundai Rotem
Crunching The Numbers
We are going to use a two-stage DCF model, which, as the name states, takes into account two stages of growth. The first stage is generally a higher growth period which levels off heading towards the terminal value, captured in the second 'steady growth' period. In the first stage we need to estimate the cash flows to the business over the next ten years. Where possible we use analyst estimates, but when these aren't available we extrapolate the previous free cash flow (FCF) from the last estimate or reported value. We assume companies with shrinking free cash flow will slow their rate of shrinkage, and that companies with growing free cash flow will see their growth rate slow, over this period. We do this to reflect that growth tends to slow more in the early years than it does in later years.
Generally we assume that a dollar today is more valuable than a dollar in the future, and so the sum of these future cash flows is then discounted to today's value:
10-year free cash flow (FCF) estimate
| 2025 | 2026 | 2027 | 2028 | 2029 | 2030 | 2031 | 2032 | 2033 | 2034 | |
| Levered FCF (₩, Millions) | ₩499.9b | ₩573.6b | ₩550.9b | ₩540.1b | ₩537.2b | ₩539.5b | ₩545.5b | ₩554.2b | ₩564.9b | ₩577.2b |
| Growth Rate Estimate Source | Analyst x6 | Analyst x6 | Est @ -3.96% | Est @ -1.95% | Est @ -0.55% | Est @ 0.43% | Est @ 1.12% | Est @ 1.60% | Est @ 1.93% | Est @ 2.17% |
| Present Value (₩, Millions) Discounted @ 7.9% | ₩463.5k | ₩493.1k | ₩439.1k | ₩399.2k | ₩368.0k | ₩342.7k | ₩321.3k | ₩302.7k | ₩286.0k | ₩271.0k |
("Est" = FCF growth rate estimated by Simply Wall St)
Present Value of 10-year Cash Flow (PVCF) = ₩3.7t
After calculating the present value of future cash flows in the initial 10-year period, we need to calculate the Terminal Value, which accounts for all future cash flows beyond the first stage. For a number of reasons a very conservative growth rate is used that cannot exceed that of a country's GDP growth. In this case we have used the 5-year average of the 10-year government bond yield (2.7%) to estimate future growth. In the same way as with the 10-year 'growth' period, we discount future cash flows to today's value, using a cost of equity of 7.9%.
Terminal Value (TV)= FCF2034 × (1 + g) ÷ (r – g) = ₩577b× (1 + 2.7%) ÷ (7.9%– 2.7%) = ₩12t
Present Value of Terminal Value (PVTV)= TV / (1 + r)10= ₩12t÷ ( 1 + 7.9%)10= ₩5.4t
The total value, or equity value, is then the sum of the present value of the future cash flows, which in this case is ₩9.1t. In the final step we divide the equity value by the number of shares outstanding. Compared to the current share price of ₩89k, the company appears around fair value at the time of writing. Remember though, that this is just an approximate valuation, and like any complex formula - garbage in, garbage out.
Important Assumptions
The calculation above is very dependent on two assumptions. The first is the discount rate and the other is the cash flows. You don't have to agree with these inputs, I recommend redoing the calculations yourself and playing with them. The DCF also does not consider the possible cyclicality of an industry, or a company's future capital requirements, so it does not give a full picture of a company's potential performance. Given that we are looking at Hyundai Rotem as potential shareholders, the cost of equity is used as the discount rate, rather than the cost of capital (or weighted average cost of capital, WACC) which accounts for debt. In this calculation we've used 7.9%, which is based on a levered beta of 1.029. Beta is a measure of a stock's volatility, compared to the market as a whole. We get our beta from the industry average beta of globally comparable companies, with an imposed limit between 0.8 and 2.0, which is a reasonable range for a stable business.
SWOT Analysis for Hyundai Rotem
Strength
- Earnings growth over the past year exceeded the industry.
- Debt is not viewed as a risk.
Weakness
- Dividend is low compared to the top 25% of dividend payers in the Machinery market.
- Expensive based on P/E ratio and estimated fair value.
Opportunity
- Annual revenue is forecast to grow faster than the South Korean market.
Threat
- Annual earnings are forecast to grow slower than the South Korean market.
Next Steps:
Whilst important, the DCF calculation shouldn't be the only metric you look at when researching a company. DCF models are not the be-all and end-all of investment valuation. Preferably you'd apply different cases and assumptions and see how they would impact the company's valuation. For example, changes in the company's cost of equity or the risk free rate can significantly impact the valuation. For Hyundai Rotem, we've compiled three further factors you should further research:
- Financial Health: Does A064350 have a healthy balance sheet? Take a look at our free balance sheet analysis with six simple checks on key factors like leverage and risk.
- Future Earnings: How does A064350's growth rate compare to its peers and the wider market? Dig deeper into the analyst consensus number for the upcoming years by interacting with our free analyst growth expectation chart.
- Other High Quality Alternatives: Do you like a good all-rounder? Explore our interactive list of high quality stocks to get an idea of what else is out there you may be missing!
PS. Simply Wall St updates its DCF calculation for every South Korean stock every day, so if you want to find the intrinsic value of any other stock just search here.
Valuation is complex, but we're here to simplify it.
Discover if Hyundai Rotem might be undervalued or overvalued with our detailed analysis, featuring fair value estimates, potential risks, dividends, insider trades, and its financial condition.
Access Free AnalysisHave feedback on this article? Concerned about the content? Get in touch with us directly. Alternatively, email editorial-team (at) simplywallst.com.
This article by Simply Wall St is general in nature. We provide commentary based on historical data and analyst forecasts only using an unbiased methodology and our articles are not intended to be financial advice. It does not constitute a recommendation to buy or sell any stock, and does not take account of your objectives, or your financial situation. We aim to bring you long-term focused analysis driven by fundamental data. Note that our analysis may not factor in the latest price-sensitive company announcements or qualitative material. Simply Wall St has no position in any stocks mentioned.
About KOSE:A064350
Hyundai Rotem
Manufactures and sells railway vehicles, defense systems, and plants and machinery in South Korea and internationally.
Outstanding track record with flawless balance sheet.
Similar Companies
Market Insights

Advertisement
Community Narratives
The company that turned a verb into a global necessity and basically runs the modern internet, digital ads, smartphones, maps, and AI.
Fair Value US$300.00|5.4% undervalued
OS
Community Contributor
Flowers Foods Pays A Fair Price For Health
Fair Value US$16.12|26.3% undervalued
NV
Community Contributor
TMX Group will thrive with 33.3% profit margin and enduring market moat
Fair Value CA$49.90|4.1% overvalued
LI
Community Contributor