
Advertisement
- South Korea
- /
- Building
- /
- KOSE:A005750
What Is Daelim B&CoLtd's (KRX:005750) P/E Ratio After Its Share Price Tanked?

Unfortunately for some shareholders, the Daelim B&CoLtd (KRX:005750) share price has dived 32% in the last thirty days. That drop has capped off a tough year for shareholders, with the share price down 53% in that time.
All else being equal, a share price drop should make a stock more attractive to potential investors. While the market sentiment towards a stock is very changeable, in the long run, the share price will tend to move in the same direction as earnings per share. The implication here is that long term investors have an opportunity when expectations of a company are too low. Perhaps the simplest way to get a read on investors' expectations of a business is to look at its Price to Earnings Ratio (PE Ratio). A high P/E ratio means that investors have a high expectation about future growth, while a low P/E ratio means they have low expectations about future growth.
View our latest analysis for Daelim B&CoLtd
Does Daelim B&CoLtd Have A Relatively High Or Low P/E For Its Industry?
Daelim B&CoLtd's P/E is 10.94. You can see in the image below that the average P/E (11.6) for companies in the building industry is roughly the same as Daelim B&CoLtd's P/E.
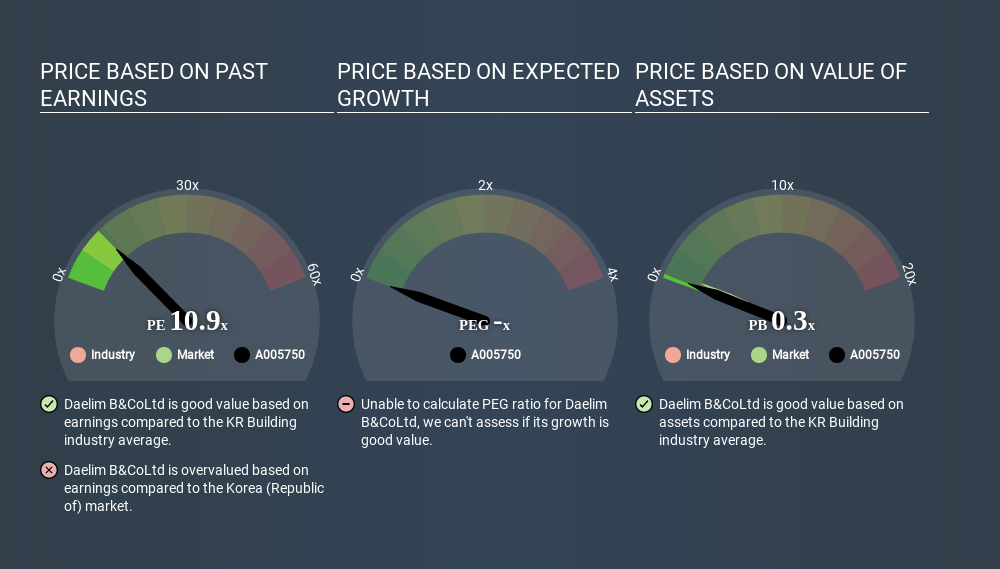
That indicates that the market expects Daelim B&CoLtd will perform roughly in line with other companies in its industry. If the company has better than average prospects, then the market might be underestimating it. Checking factors such as director buying and selling. could help you form your own view on if that will happen.
How Growth Rates Impact P/E Ratios
When earnings fall, the 'E' decreases, over time. That means even if the current P/E is low, it will increase over time if the share price stays flat. Then, a higher P/E might scare off shareholders, pushing the share price down.
Daelim B&CoLtd saw earnings per share improve by 8.6% last year. And it has bolstered its earnings per share by 89% per year over the last five years. But earnings per share are down 29% per year over the last three years.
A Limitation: P/E Ratios Ignore Debt and Cash In The Bank
One drawback of using a P/E ratio is that it considers market capitalization, but not the balance sheet. That means it doesn't take debt or cash into account. Theoretically, a business can improve its earnings (and produce a lower P/E in the future) by investing in growth. That means taking on debt (or spending its cash).
Spending on growth might be good or bad a few years later, but the point is that the P/E ratio does not account for the option (or lack thereof).
So What Does Daelim B&CoLtd's Balance Sheet Tell Us?
Net debt totals a substantial 138% of Daelim B&CoLtd's market cap. This level of debt justifies a relatively low P/E, so remain cognizant of the debt, if you're comparing it to other stocks.
The Bottom Line On Daelim B&CoLtd's P/E Ratio
Daelim B&CoLtd has a P/E of 10.9. That's around the same as the average in the KR market, which is 10.8. It has significant debt, though the market seems to take confidence from recent earnings growth. Given Daelim B&CoLtd's P/E ratio has declined from 16.1 to 10.9 in the last month, we know for sure that the market is significantly less confident about the business today, than it was back then. For those who don't like to trade against momentum, that could be a warning sign, but a contrarian investor might want to take a closer look.
Investors should be looking to buy stocks that the market is wrong about. If the reality for a company is better than it expects, you can make money by buying and holding for the long term. We don't have analyst forecasts, but shareholders might want to examine this detailed historical graph of earnings, revenue and cash flow.
You might be able to find a better buy than Daelim B&CoLtd. If you want a selection of possible winners, check out this free list of interesting companies that trade on a P/E below 20 (but have proven they can grow earnings).
If you spot an error that warrants correction, please contact the editor at editorial-team@simplywallst.com. This article by Simply Wall St is general in nature. It does not constitute a recommendation to buy or sell any stock, and does not take account of your objectives, or your financial situation. Simply Wall St has no position in the stocks mentioned.
We aim to bring you long-term focused research analysis driven by fundamental data. Note that our analysis may not factor in the latest price-sensitive company announcements or qualitative material. Thank you for reading.
About KOSE:A005750
Excellent balance sheet, good value and pays a dividend.
Market Insights

Advertisement
Community Narratives
The Future of Drug Testing? Fingerprint Tech Shows Serious Promise
Fair Value US$2.98|36.2% undervalued
JO
Community Contributor
Occidental Petroleum is set to achieve a 16% profit margin improvement
Fair Value US$55.05|18.7% undervalued
DZ
Community Contributor
Argan's Revenue Set to Soar with a 13.31% Growth in the Coming Decade
Fair Value US$284.68|22.0% undervalued
KE
Community Contributor
EU#1 - From German Startup to EU’s Biggest Company
Fair Value €248.62|5.0% overvalued
TO
Community Contributor