
Advertisement
- South Korea
- /
- Electrical
- /
- KOSDAQ:A243840
What Do The Returns At Shin Heung Energy & ElectronicsLtd (KOSDAQ:243840) Mean Going Forward?
If we want to find a stock that could multiply over the long term, what are the underlying trends we should look for? In a perfect world, we'd like to see a company investing more capital into its business and ideally the returns earned from that capital are also increasing. Ultimately, this demonstrates that it's a business that is reinvesting profits at increasing rates of return. So when we looked at Shin Heung Energy & ElectronicsLtd (KOSDAQ:243840) and its trend of ROCE, we really liked what we saw.
What is Return On Capital Employed (ROCE)?
Just to clarify if you're unsure, ROCE is a metric for evaluating how much pre-tax income (in percentage terms) a company earns on the capital invested in its business. The formula for this calculation on Shin Heung Energy & ElectronicsLtd is:
Return on Capital Employed = Earnings Before Interest and Tax (EBIT) ÷ (Total Assets - Current Liabilities)
0.11 = ₩22b ÷ (₩353b - ₩153b) (Based on the trailing twelve months to September 2020).
Therefore, Shin Heung Energy & ElectronicsLtd has an ROCE of 11%. In absolute terms, that's a satisfactory return, but compared to the Electrical industry average of 6.8% it's much better.
See our latest analysis for Shin Heung Energy & ElectronicsLtd
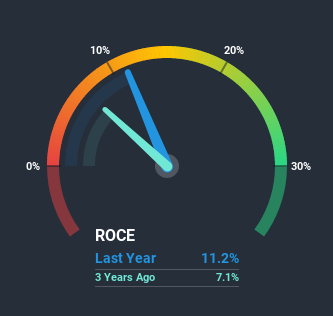
Above you can see how the current ROCE for Shin Heung Energy & ElectronicsLtd compares to its prior returns on capital, but there's only so much you can tell from the past. If you're interested, you can view the analysts predictions in our free report on analyst forecasts for the company.
What Can We Tell From Shin Heung Energy & ElectronicsLtd's ROCE Trend?
The trends we've noticed at Shin Heung Energy & ElectronicsLtd are quite reassuring. The data shows that returns on capital have increased substantially over the last five years to 11%. Basically the business is earning more per dollar of capital invested and in addition to that, 269% more capital is being employed now too. This can indicate that there's plenty of opportunities to invest capital internally and at ever higher rates, a combination that's common among multi-baggers.
On a side note, we noticed that the improvement in ROCE appears to be partly fueled by an increase in current liabilities. The current liabilities has increased to 43% of total assets, so the business is now more funded by the likes of its suppliers or short-term creditors. And with current liabilities at those levels, that's pretty high.
The Bottom Line
To sum it up, Shin Heung Energy & ElectronicsLtd has proven it can reinvest in the business and generate higher returns on that capital employed, which is terrific. And with a respectable 83% awarded to those who held the stock over the last three years, you could argue that these developments are starting to get the attention they deserve. In light of that, we think it's worth looking further into this stock because if Shin Heung Energy & ElectronicsLtd can keep these trends up, it could have a bright future ahead.
One more thing to note, we've identified 2 warning signs with Shin Heung Energy & ElectronicsLtd and understanding them should be part of your investment process.
While Shin Heung Energy & ElectronicsLtd may not currently earn the highest returns, we've compiled a list of companies that currently earn more than 25% return on equity. Check out this free list here.
If you’re looking to trade Shin Heung Energy & ElectronicsLtd, open an account with the lowest-cost* platform trusted by professionals, Interactive Brokers. Their clients from over 200 countries and territories trade stocks, options, futures, forex, bonds and funds worldwide from a single integrated account. Promoted
New: Manage All Your Stock Portfolios in One Place
We've created the ultimate portfolio companion for stock investors, and it's free.
• Connect an unlimited number of Portfolios and see your total in one currency
• Be alerted to new Warning Signs or Risks via email or mobile
• Track the Fair Value of your stocks
This article by Simply Wall St is general in nature. It does not constitute a recommendation to buy or sell any stock, and does not take account of your objectives, or your financial situation. We aim to bring you long-term focused analysis driven by fundamental data. Note that our analysis may not factor in the latest price-sensitive company announcements or qualitative material. Simply Wall St has no position in any stocks mentioned.
*Interactive Brokers Rated Lowest Cost Broker by StockBrokers.com Annual Online Review 2020
Have feedback on this article? Concerned about the content? Get in touch with us directly. Alternatively, email editorial-team (at) simplywallst.com.
About KOSDAQ:A243840
Shin Heung Energy & ElectronicsLtd
Engages in the manufacturing and sale of parts and facilities for the secondary battery markets in South Korea and internationally.
Undervalued with reasonable growth potential.
Market Insights

Advertisement
Community Narratives
MicroVision will explode future revenue by 380.37% with a vision towards success
Fair Value US$60.00|98.5% undervalued
TH
Community Contributor
The Indispensable Artery for a New North American Economy
Fair Value CA$132.87|2.3% undervalued
TI
Community Contributor