- South Korea
- /
- Electrical
- /
- KOSDAQ:A147830
Declining Stock and Decent Financials: Is The Market Wrong About Cheryong Industrial Co.,Ltd. (KOSDAQ:147830)?


With its stock down 21% over the past month, it is easy to disregard Cheryong IndustrialLtd (KOSDAQ:147830). However, stock prices are usually driven by a company’s financials over the long term, which in this case look pretty respectable. Specifically, we decided to study Cheryong IndustrialLtd's ROE in this article.
Return on equity or ROE is a key measure used to assess how efficiently a company's management is utilizing the company's capital. In simpler terms, it measures the profitability of a company in relation to shareholder's equity.
Check out our latest analysis for Cheryong IndustrialLtd
How To Calculate Return On Equity?
ROE can be calculated by using the formula:
Return on Equity = Net Profit (from continuing operations) ÷ Shareholders' Equity
So, based on the above formula, the ROE for Cheryong IndustrialLtd is:
8.0% = ₩6.1b ÷ ₩76b (Based on the trailing twelve months to June 2024).
The 'return' is the income the business earned over the last year. That means that for every ₩1 worth of shareholders' equity, the company generated ₩0.08 in profit.
What Is The Relationship Between ROE And Earnings Growth?
So far, we've learned that ROE is a measure of a company's profitability. Based on how much of its profits the company chooses to reinvest or "retain", we are then able to evaluate a company's future ability to generate profits. Generally speaking, other things being equal, firms with a high return on equity and profit retention, have a higher growth rate than firms that don’t share these attributes.
A Side By Side comparison of Cheryong IndustrialLtd's Earnings Growth And 8.0% ROE
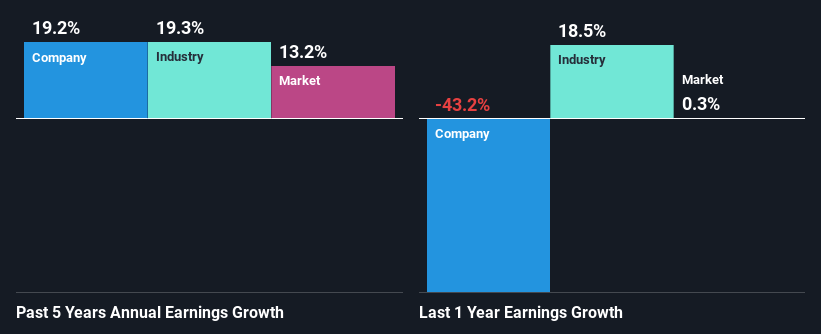
On the face of it, Cheryong IndustrialLtd's ROE is not much to talk about. Yet, a closer study shows that the company's ROE is similar to the industry average of 8.0%. Even so, Cheryong IndustrialLtd has shown a fairly decent growth in its net income which grew at a rate of 19%. Considering the moderately low ROE, it is quite possible that there might be some other aspects that are positively influencing the company's earnings growth. Such as - high earnings retention or an efficient management in place.
Next, on comparing Cheryong IndustrialLtd's net income growth with the industry, we found that the company's reported growth is similar to the industry average growth rate of 19% over the last few years.
Earnings growth is a huge factor in stock valuation. It’s important for an investor to know whether the market has priced in the company's expected earnings growth (or decline). This then helps them determine if the stock is placed for a bright or bleak future. Is Cheryong IndustrialLtd fairly valued compared to other companies? These 3 valuation measures might help you decide.
Is Cheryong IndustrialLtd Making Efficient Use Of Its Profits?
Conclusion
Overall, we feel that Cheryong IndustrialLtd certainly does have some positive factors to consider. Even in spite of the low rate of return, the company has posted impressive earnings growth as a result of reinvesting heavily into its business. While we won't completely dismiss the company, what we would do, is try to ascertain how risky the business is to make a more informed decision around the company. To know the 3 risks we have identified for Cheryong IndustrialLtd visit our risks dashboard for free.
New: AI Stock Screener & Alerts
Our new AI Stock Screener scans the market every day to uncover opportunities.
• Dividend Powerhouses (3%+ Yield)
• Undervalued Small Caps with Insider Buying
• High growth Tech and AI Companies
Or build your own from over 50 metrics.
Have feedback on this article? Concerned about the content? Get in touch with us directly. Alternatively, email editorial-team (at) simplywallst.com.
This article by Simply Wall St is general in nature. We provide commentary based on historical data and analyst forecasts only using an unbiased methodology and our articles are not intended to be financial advice. It does not constitute a recommendation to buy or sell any stock, and does not take account of your objectives, or your financial situation. We aim to bring you long-term focused analysis driven by fundamental data. Note that our analysis may not factor in the latest price-sensitive company announcements or qualitative material. Simply Wall St has no position in any stocks mentioned.
About KOSDAQ:A147830
Cheryong IndustrialLtd
Manufactures and sells transmission and distribution materials, underground cable materials, communication equipment, and railway materials in South Korea.
Flawless balance sheet with acceptable track record.

