
Advertisement
- South Korea
- /
- Electrical
- /
- KOSDAQ:A091580
Be Wary Of Sangsin Energy Display PrecisionLtd (KOSDAQ:091580) And Its Returns On Capital
To find a multi-bagger stock, what are the underlying trends we should look for in a business? Firstly, we'd want to identify a growing return on capital employed (ROCE) and then alongside that, an ever-increasing base of capital employed. This shows us that it's a compounding machine, able to continually reinvest its earnings back into the business and generate higher returns. Having said that, from a first glance at Sangsin Energy Display PrecisionLtd (KOSDAQ:091580) we aren't jumping out of our chairs at how returns are trending, but let's have a deeper look.
What Is Return On Capital Employed (ROCE)?
Just to clarify if you're unsure, ROCE is a metric for evaluating how much pre-tax income (in percentage terms) a company earns on the capital invested in its business. To calculate this metric for Sangsin Energy Display PrecisionLtd, this is the formula:
Return on Capital Employed = Earnings Before Interest and Tax (EBIT) ÷ (Total Assets - Current Liabilities)
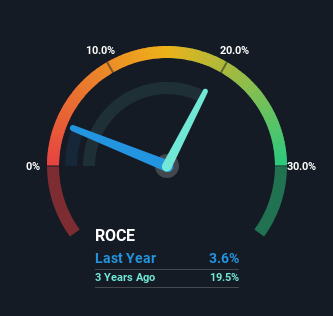
0.036 = ₩6.5b ÷ (₩298b - ₩121b) (Based on the trailing twelve months to September 2024).
Thus, Sangsin Energy Display PrecisionLtd has an ROCE of 3.6%. Ultimately, that's a low return and it under-performs the Electrical industry average of 7.7%.
Check out our latest analysis for Sangsin Energy Display PrecisionLtd
While the past is not representative of the future, it can be helpful to know how a company has performed historically, which is why we have this chart above. If you're interested in investigating Sangsin Energy Display PrecisionLtd's past further, check out this free graph covering Sangsin Energy Display PrecisionLtd's past earnings, revenue and cash flow.
So How Is Sangsin Energy Display PrecisionLtd's ROCE Trending?
In terms of Sangsin Energy Display PrecisionLtd's historical ROCE movements, the trend isn't fantastic. Around five years ago the returns on capital were 12%, but since then they've fallen to 3.6%. Given the business is employing more capital while revenue has slipped, this is a bit concerning. This could mean that the business is losing its competitive advantage or market share, because while more money is being put into ventures, it's actually producing a lower return - "less bang for their buck" per se.
On a side note, Sangsin Energy Display PrecisionLtd's current liabilities are still rather high at 41% of total assets. This can bring about some risks because the company is basically operating with a rather large reliance on its suppliers or other sorts of short-term creditors. Ideally we'd like to see this reduce as that would mean fewer obligations bearing risks.
In Conclusion...
From the above analysis, we find it rather worrisome that returns on capital and sales for Sangsin Energy Display PrecisionLtd have fallen, meanwhile the business is employing more capital than it was five years ago. And, the stock has remained flat over the last five years, so investors don't seem too impressed either. Unless there is a shift to a more positive trajectory in these metrics, we would look elsewhere.
Like most companies, Sangsin Energy Display PrecisionLtd does come with some risks, and we've found 4 warning signs that you should be aware of.
For those who like to invest in solid companies, check out this free list of companies with solid balance sheets and high returns on equity.
New: Manage All Your Stock Portfolios in One Place
We've created the ultimate portfolio companion for stock investors, and it's free.
• Connect an unlimited number of Portfolios and see your total in one currency
• Be alerted to new Warning Signs or Risks via email or mobile
• Track the Fair Value of your stocks
Have feedback on this article? Concerned about the content? Get in touch with us directly. Alternatively, email editorial-team (at) simplywallst.com.
This article by Simply Wall St is general in nature. We provide commentary based on historical data and analyst forecasts only using an unbiased methodology and our articles are not intended to be financial advice. It does not constitute a recommendation to buy or sell any stock, and does not take account of your objectives, or your financial situation. We aim to bring you long-term focused analysis driven by fundamental data. Note that our analysis may not factor in the latest price-sensitive company announcements or qualitative material. Simply Wall St has no position in any stocks mentioned.
About KOSDAQ:A091580
Sangsin Energy Display PrecisionLtd
Sangsin Energy Display Precision Co.,Ltd.
Low risk and slightly overvalued.
Market Insights

Advertisement
Community Narratives
The company that turned a verb into a global necessity and basically runs the modern internet, digital ads, smartphones, maps, and AI.
Fair Value US$300.00|6.3% undervalued
OS
Community Contributor
Flowers Foods Pays A Fair Price For Health
Fair Value US$16.12|26.0% undervalued
NV
Community Contributor
TMX Group will thrive with 33.3% profit margin and enduring market moat
Fair Value CA$49.90|3.7% overvalued
LI
Community Contributor