Stock Analysis
- South Korea
- /
- Auto Components
- /
- KOSE:A005850
Is SL Corporation's (KRX:005850) Latest Stock Performance A Reflection Of Its Financial Health?


SL's (KRX:005850) stock is up by a considerable 21% over the past three months. Given the company's impressive performance, we decided to study its financial indicators more closely as a company's financial health over the long-term usually dictates market outcomes. Particularly, we will be paying attention to SL's ROE today.
Return on equity or ROE is an important factor to be considered by a shareholder because it tells them how effectively their capital is being reinvested. In short, ROE shows the profit each dollar generates with respect to its shareholder investments.
Check out our latest analysis for SL
How To Calculate Return On Equity?
The formula for return on equity is:
Return on Equity = Net Profit (from continuing operations) ÷ Shareholders' Equity
So, based on the above formula, the ROE for SL is:
18% = ₩376b ÷ ₩2.1t (Based on the trailing twelve months to March 2024).
The 'return' is the amount earned after tax over the last twelve months. So, this means that for every ₩1 of its shareholder's investments, the company generates a profit of ₩0.18.
What Is The Relationship Between ROE And Earnings Growth?
So far, we've learned that ROE is a measure of a company's profitability. Based on how much of its profits the company chooses to reinvest or "retain", we are then able to evaluate a company's future ability to generate profits. Assuming everything else remains unchanged, the higher the ROE and profit retention, the higher the growth rate of a company compared to companies that don't necessarily bear these characteristics.
SL's Earnings Growth And 18% ROE
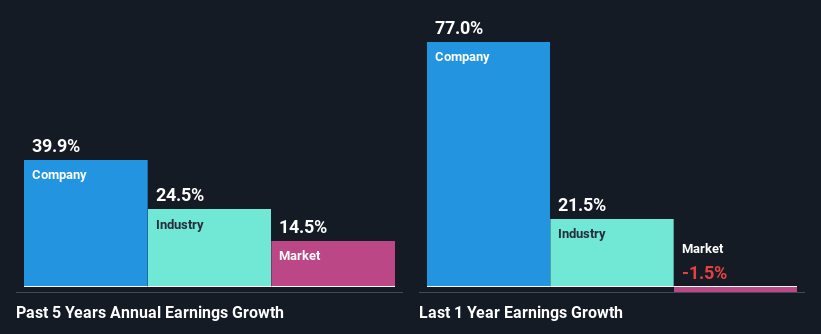
To begin with, SL seems to have a respectable ROE. On comparing with the average industry ROE of 7.6% the company's ROE looks pretty remarkable. This probably laid the ground for SL's significant 40% net income growth seen over the past five years. We believe that there might also be other aspects that are positively influencing the company's earnings growth. For instance, the company has a low payout ratio or is being managed efficiently.
As a next step, we compared SL's net income growth with the industry, and pleasingly, we found that the growth seen by the company is higher than the average industry growth of 25%.
Earnings growth is a huge factor in stock valuation. The investor should try to establish if the expected growth or decline in earnings, whichever the case may be, is priced in. Doing so will help them establish if the stock's future looks promising or ominous. One good indicator of expected earnings growth is the P/E ratio which determines the price the market is willing to pay for a stock based on its earnings prospects. So, you may want to check if SL is trading on a high P/E or a low P/E, relative to its industry.
Is SL Efficiently Re-investing Its Profits?
SL's three-year median payout ratio to shareholders is 16%, which is quite low. This implies that the company is retaining 84% of its profits. This suggests that the management is reinvesting most of the profits to grow the business as evidenced by the growth seen by the company.
Moreover, SL is determined to keep sharing its profits with shareholders which we infer from its long history of five years of paying a dividend. Our latest analyst data shows that the future payout ratio of the company is expected to drop to 12% over the next three years. However, the company's ROE is not expected to change by much despite the lower expected payout ratio.
Conclusion
In total, we are pretty happy with SL's performance. In particular, it's great to see that the company is investing heavily into its business and along with a high rate of return, that has resulted in a sizeable growth in its earnings. Having said that, the company's earnings growth is expected to slow down, as forecasted in the current analyst estimates. To know more about the latest analysts predictions for the company, check out this visualization of analyst forecasts for the company.
Valuation is complex, but we're helping make it simple.
Find out whether SL is potentially over or undervalued by checking out our comprehensive analysis, which includes fair value estimates, risks and warnings, dividends, insider transactions and financial health.
View the Free AnalysisHave feedback on this article? Concerned about the content? Get in touch with us directly. Alternatively, email editorial-team (at) simplywallst.com.
This article by Simply Wall St is general in nature. We provide commentary based on historical data and analyst forecasts only using an unbiased methodology and our articles are not intended to be financial advice. It does not constitute a recommendation to buy or sell any stock, and does not take account of your objectives, or your financial situation. We aim to bring you long-term focused analysis driven by fundamental data. Note that our analysis may not factor in the latest price-sensitive company announcements or qualitative material. Simply Wall St has no position in any stocks mentioned.
About KOSE:A005850
SL
Manufactures and sells automotive parts in South Korea, North America, China, India, Europe, South America, and internationally.
Flawless balance sheet with solid track record.
