
Advertisement
- South Korea
- /
- Auto Components
- /
- KOSDAQ:A053270
Here's Why Guyoung Technology (KOSDAQ:053270) Is Weighed Down By Its Debt Load
Legendary fund manager Li Lu (who Charlie Munger backed) once said, 'The biggest investment risk is not the volatility of prices, but whether you will suffer a permanent loss of capital.' When we think about how risky a company is, we always like to look at its use of debt, since debt overload can lead to ruin. Importantly, Guyoung Technology Co., Ltd (KOSDAQ:053270) does carry debt. But the real question is whether this debt is making the company risky.
What Risk Does Debt Bring?
Generally speaking, debt only becomes a real problem when a company can't easily pay it off, either by raising capital or with its own cash flow. Part and parcel of capitalism is the process of 'creative destruction' where failed businesses are mercilessly liquidated by their bankers. However, a more common (but still painful) scenario is that it has to raise new equity capital at a low price, thus permanently diluting shareholders. Of course, the upside of debt is that it often represents cheap capital, especially when it replaces dilution in a company with the ability to reinvest at high rates of return. When we think about a company's use of debt, we first look at cash and debt together.
See our latest analysis for Guyoung Technology
How Much Debt Does Guyoung Technology Carry?
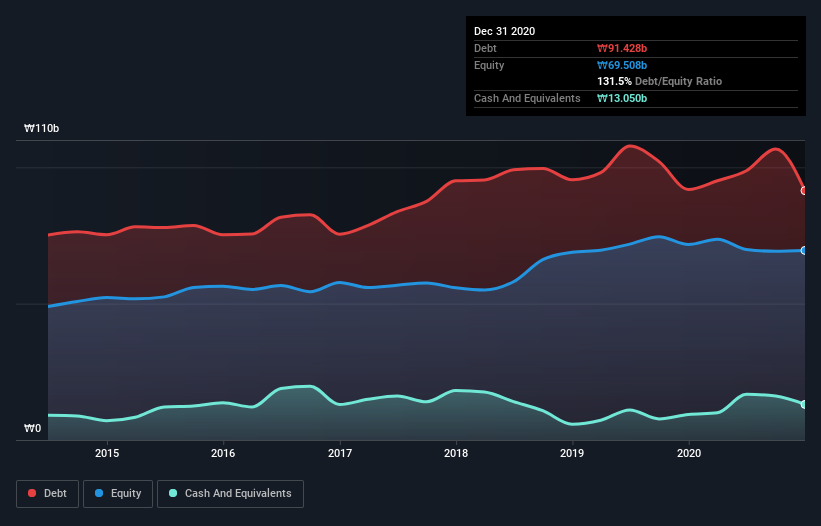
As you can see below, Guyoung Technology had ₩91.4b of debt, at December 2020, which is about the same as the year before. You can click the chart for greater detail. However, it does have ₩13.1b in cash offsetting this, leading to net debt of about ₩78.4b.
A Look At Guyoung Technology's Liabilities
We can see from the most recent balance sheet that Guyoung Technology had liabilities of ₩99.5b falling due within a year, and liabilities of ₩42.8b due beyond that. Offsetting these obligations, it had cash of ₩13.1b as well as receivables valued at ₩26.6b due within 12 months. So its liabilities total ₩102.6b more than the combination of its cash and short-term receivables.
Given this deficit is actually higher than the company's market capitalization of ₩94.5b, we think shareholders really should watch Guyoung Technology's debt levels, like a parent watching their child ride a bike for the first time. Hypothetically, extremely heavy dilution would be required if the company were forced to pay down its liabilities by raising capital at the current share price.
In order to size up a company's debt relative to its earnings, we calculate its net debt divided by its earnings before interest, tax, depreciation, and amortization (EBITDA) and its earnings before interest and tax (EBIT) divided by its interest expense (its interest cover). The advantage of this approach is that we take into account both the absolute quantum of debt (with net debt to EBITDA) and the actual interest expenses associated with that debt (with its interest cover ratio).
While Guyoung Technology's debt to EBITDA ratio (4.9) suggests that it uses some debt, its interest cover is very weak, at 1.1, suggesting high leverage. In large part that's due to the company's significant depreciation and amortisation charges, which arguably mean its EBITDA is a very generous measure of earnings, and its debt may be more of a burden than it first appears. It seems clear that the cost of borrowing money is negatively impacting returns for shareholders, of late. Even worse, Guyoung Technology saw its EBIT tank 44% over the last 12 months. If earnings continue to follow that trajectory, paying off that debt load will be harder than convincing us to run a marathon in the rain. When analysing debt levels, the balance sheet is the obvious place to start. But it is Guyoung Technology's earnings that will influence how the balance sheet holds up in the future. So if you're keen to discover more about its earnings, it might be worth checking out this graph of its long term earnings trend.
Finally, a company can only pay off debt with cold hard cash, not accounting profits. So we always check how much of that EBIT is translated into free cash flow. Over the last three years, Guyoung Technology saw substantial negative free cash flow, in total. While that may be a result of expenditure for growth, it does make the debt far more risky.
Our View
On the face of it, Guyoung Technology's conversion of EBIT to free cash flow left us tentative about the stock, and its EBIT growth rate was no more enticing than the one empty restaurant on the busiest night of the year. And even its net debt to EBITDA fails to inspire much confidence. Considering all the factors previously mentioned, we think that Guyoung Technology really is carrying too much debt. To our minds, that means the stock is rather high risk, and probably one to avoid; but to each their own (investing) style. When analysing debt levels, the balance sheet is the obvious place to start. However, not all investment risk resides within the balance sheet - far from it. We've identified 7 warning signs with Guyoung Technology (at least 2 which are a bit concerning) , and understanding them should be part of your investment process.
At the end of the day, it's often better to focus on companies that are free from net debt. You can access our special list of such companies (all with a track record of profit growth). It's free.
If you're looking for stocks to buy, use the lowest-cost* platform that is rated #1 Overall by Barron’s, Interactive Brokers. Trade stocks, options, futures, forex, bonds and funds on 135 markets, all from a single integrated account. Promoted
New: Manage All Your Stock Portfolios in One Place
We've created the ultimate portfolio companion for stock investors, and it's free.
• Connect an unlimited number of Portfolios and see your total in one currency
• Be alerted to new Warning Signs or Risks via email or mobile
• Track the Fair Value of your stocks
This article by Simply Wall St is general in nature. It does not constitute a recommendation to buy or sell any stock, and does not take account of your objectives, or your financial situation. We aim to bring you long-term focused analysis driven by fundamental data. Note that our analysis may not factor in the latest price-sensitive company announcements or qualitative material. Simply Wall St has no position in any stocks mentioned.
*Interactive Brokers Rated Lowest Cost Broker by StockBrokers.com Annual Online Review 2020
Have feedback on this article? Concerned about the content? Get in touch with us directly. Alternatively, email editorial-team (at) simplywallst.com.
About KOSDAQ:A053270
Guyoung Technology
Manufactures and supplies car parts in South Korea, the United States, China, and internationally.
Adequate balance sheet with slight risk.
Market Insights

Advertisement
Community Narratives
MicroVision will explode future revenue by 380.37% with a vision towards success
Fair Value US$60.00|98.4% undervalued
TH
Community Contributor
The Indispensable Artery for a New North American Economy
Fair Value CA$132.87|1.3% undervalued
TI
Community Contributor