
Advertisement
- South Korea
- /
- Auto Components
- /
- KOSDAQ:A053270
Does Guyoung Technology (KOSDAQ:053270) Have A Healthy Balance Sheet?
David Iben put it well when he said, 'Volatility is not a risk we care about. What we care about is avoiding the permanent loss of capital.' It's only natural to consider a company's balance sheet when you examine how risky it is, since debt is often involved when a business collapses. We can see that Guyoung Technology Co., Ltd (KOSDAQ:053270) does use debt in its business. But the real question is whether this debt is making the company risky.
Why Does Debt Bring Risk?
Debt assists a business until the business has trouble paying it off, either with new capital or with free cash flow. If things get really bad, the lenders can take control of the business. However, a more common (but still painful) scenario is that it has to raise new equity capital at a low price, thus permanently diluting shareholders. Of course, the upside of debt is that it often represents cheap capital, especially when it replaces dilution in a company with the ability to reinvest at high rates of return. The first step when considering a company's debt levels is to consider its cash and debt together.
Check out our latest analysis for Guyoung Technology
What Is Guyoung Technology's Net Debt?
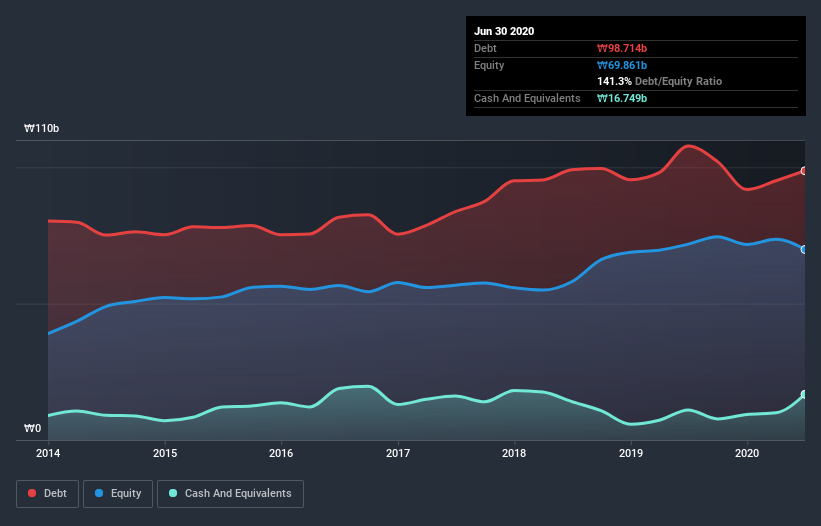
You can click the graphic below for the historical numbers, but it shows that Guyoung Technology had ₩98.7b of debt in June 2020, down from ₩107.8b, one year before. However, it also had ₩16.7b in cash, and so its net debt is ₩82.0b.
How Healthy Is Guyoung Technology's Balance Sheet?
Zooming in on the latest balance sheet data, we can see that Guyoung Technology had liabilities of ₩95.9b due within 12 months and liabilities of ₩49.3b due beyond that. Offsetting these obligations, it had cash of ₩16.7b as well as receivables valued at ₩14.6b due within 12 months. So its liabilities outweigh the sum of its cash and (near-term) receivables by ₩113.9b.
The deficiency here weighs heavily on the ₩42.9b company itself, as if a child were struggling under the weight of an enormous back-pack full of books, his sports gear, and a trumpet. So we'd watch its balance sheet closely, without a doubt. After all, Guyoung Technology would likely require a major re-capitalisation if it had to pay its creditors today. The balance sheet is clearly the area to focus on when you are analysing debt. But you can't view debt in total isolation; since Guyoung Technology will need earnings to service that debt. So if you're keen to discover more about its earnings, it might be worth checking out this graph of its long term earnings trend.
In the last year Guyoung Technology had a loss before interest and tax, and actually shrunk its revenue by 13%, to ₩197b. That's not what we would hope to see.
Caveat Emptor
Not only did Guyoung Technology's revenue slip over the last twelve months, but it also produced negative earnings before interest and tax (EBIT). To be specific the EBIT loss came in at ₩290m. Combining this information with the significant liabilities we already touched on makes us very hesitant about this stock, to say the least. That said, it is possible that the company will turn its fortunes around. Nevertheless, we would not bet on it given that it vaporized ₩3.1b in cash over the last twelve months, and it doesn't have much by way of liquid assets. So we think this stock is risky, like walking through a dirty dog park with a mask on. There's no doubt that we learn most about debt from the balance sheet. But ultimately, every company can contain risks that exist outside of the balance sheet. For instance, we've identified 4 warning signs for Guyoung Technology (2 are concerning) you should be aware of.
Of course, if you're the type of investor who prefers buying stocks without the burden of debt, then don't hesitate to discover our exclusive list of net cash growth stocks, today.
If you’re looking to trade Guyoung Technology, open an account with the lowest-cost* platform trusted by professionals, Interactive Brokers. Their clients from over 200 countries and territories trade stocks, options, futures, forex, bonds and funds worldwide from a single integrated account. Promoted
New: Manage All Your Stock Portfolios in One Place
We've created the ultimate portfolio companion for stock investors, and it's free.
• Connect an unlimited number of Portfolios and see your total in one currency
• Be alerted to new Warning Signs or Risks via email or mobile
• Track the Fair Value of your stocks
This article by Simply Wall St is general in nature. It does not constitute a recommendation to buy or sell any stock, and does not take account of your objectives, or your financial situation. We aim to bring you long-term focused analysis driven by fundamental data. Note that our analysis may not factor in the latest price-sensitive company announcements or qualitative material. Simply Wall St has no position in any stocks mentioned.
*Interactive Brokers Rated Lowest Cost Broker by StockBrokers.com Annual Online Review 2020
Have feedback on this article? Concerned about the content? Get in touch with us directly. Alternatively, email editorial-team@simplywallst.com.
About KOSDAQ:A053270
Guyoung Technology
Manufactures and supplies car parts in South Korea, the United States, China, and internationally.
Adequate balance sheet with slight risk.
Market Insights

Advertisement
Community Narratives
MicroVision will explode future revenue by 380.37% with a vision towards success
Fair Value US$60.00|98.4% undervalued
TH
Community Contributor
The Indispensable Artery for a New North American Economy
Fair Value CA$132.87|1.3% undervalued
TI
Community Contributor