Advertisement
- Japan
- /
- Renewable Energy
- /
- TSE:9513
Electric Power Development (TSE:9513) Margin Tops 8%, Challenging Stability Narrative as Growth Outlook Turns Negative

Simply Wall St
Reviewed by Simply Wall St
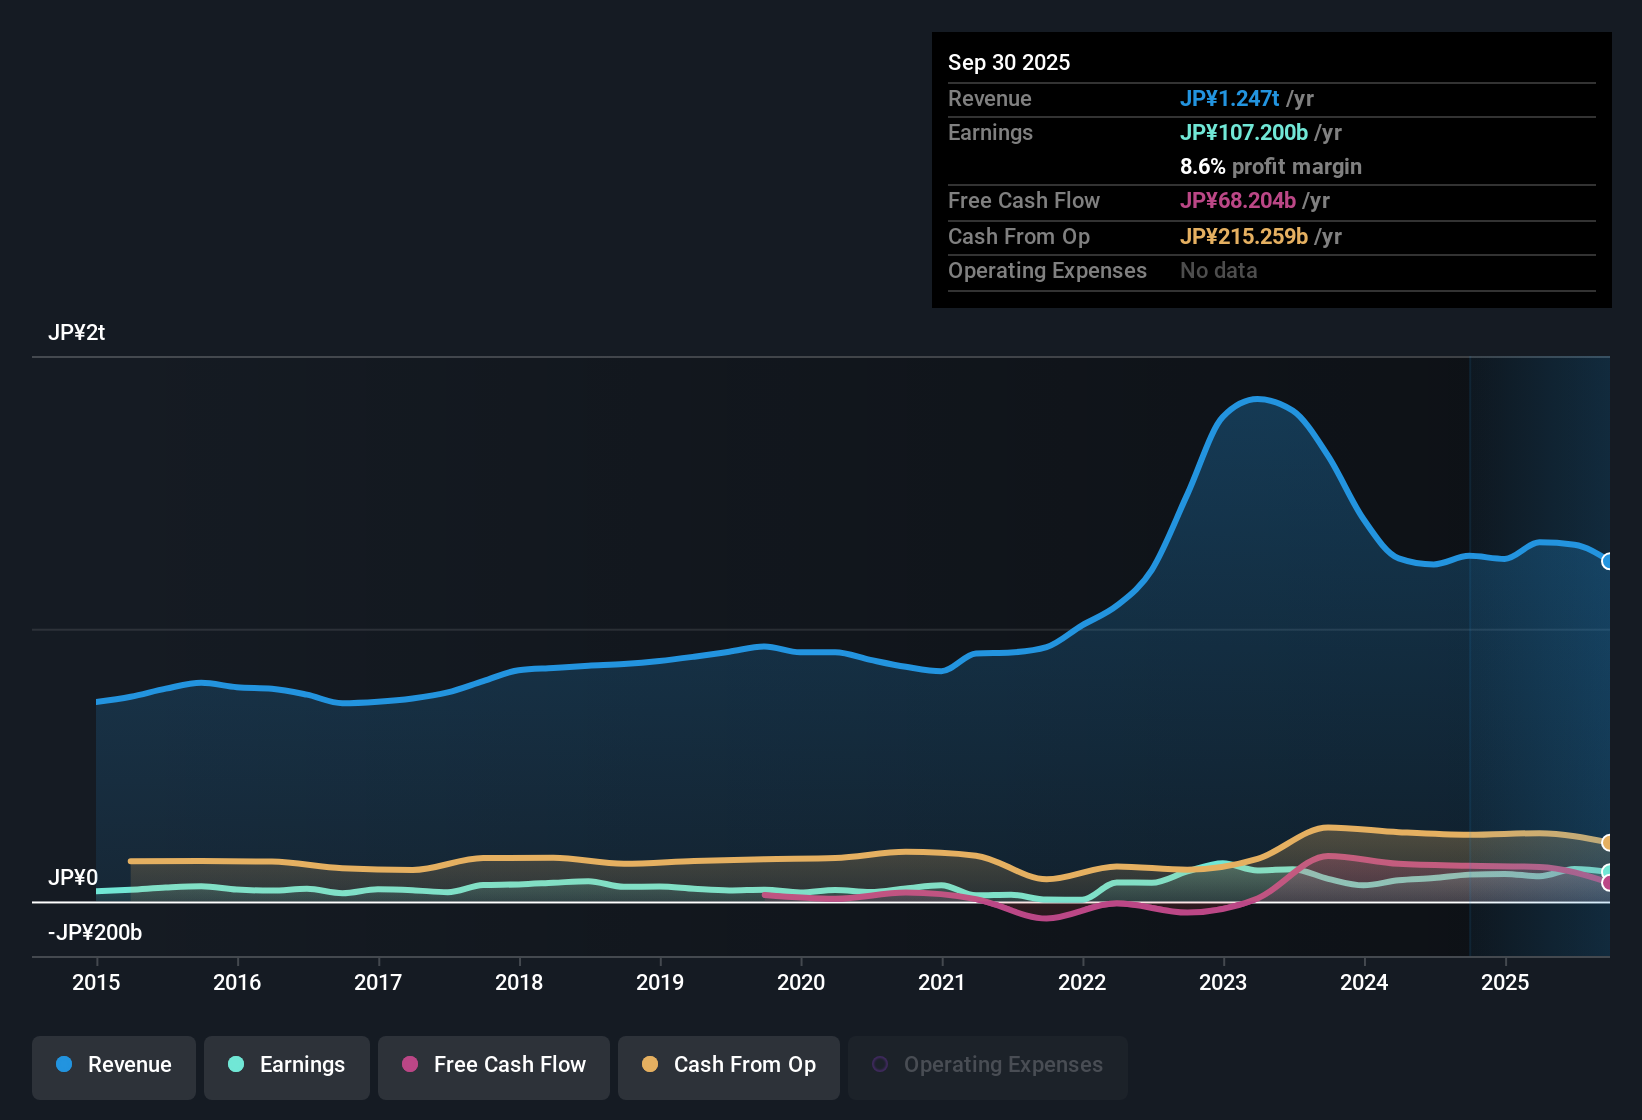
Electric Power Development (TSE:9513) posted a net profit margin of 8.6%, up from 7.8% the previous year, while EPS climbed 9% for the period. Over the past five years, annual earnings growth averaged 21%, but both revenue and earnings are forecast to decline in the years ahead, with earnings expected to fall 13.1% per year and revenue by 1% per year. Investors now face a mix of attractive valuation metrics, such as a price-to-earnings ratio of 4.9x, well below industry benchmarks, set against clear signs that the company’s top and bottom lines could be headed for tougher times.
See our full analysis for Electric Power Development.Next, we take a closer look at how these results stack up against the dominant market narratives, pinpointing where the numbers confirm the story and where they surprise.
Curious how numbers become stories that shape markets? Explore Community Narratives
Profit Margin Holds Above 8%
- Net profit margin came in at 8.6% for the latest period, slightly up from 7.8% a year ago, even as the annual earnings growth rate slowed from its five-year average of 21% to just 9% over the past year.
- Despite margin stability, the prevailing narrative about Electric Power Development’s role as a stable utility gets tested for the following reasons:
- The company’s profit margin improvement stands in contrast to the projected 13.1% annual earnings decline over the next three years, suggesting that future pressures may challenge ongoing stability.
- Market sentiment often favors utilities with consistent margins; however, the expected downturn in earnings raises questions about how long this level of profitability can be sustained.
Industry Discount Looks Enticing
- Electric Power Development’s price-to-earnings ratio is 4.9x, a significant discount to both the Asian renewable energy industry average of 17.2x and the peer average of 13.8x. However, shares are actually trading above their DCF fair value of 1,723.51, with the current price at 2,930.50.
- Valuation narrative centers around this deep peer discount, but prevailing market analysis urges caution for several reasons:
- The low price-to-earnings ratio may attract value-oriented investors. Yet the fact that the share price sits above its DCF fair value sparks debate about whether the market is already factoring in a future slowdown.
- Comparing these valuation metrics with the risk of declining revenue and earnings highlights the tension between statistical cheapness and underlying business headwinds.
Forecasts Point to Tougher Road Ahead
- Both revenue and earnings are anticipated to decrease over the next three years, with revenue expected to fall by 1% annually and earnings forecasted to decline by 13.1% per year. This shift marks a major contrast from the robust trends seen over the past five years.
- Risk analysis emphasizes the impact of this projected negative growth:
- The company’s historical five-year average annual earnings growth of 21% makes the sudden swing to contraction especially significant and challenges the idea that strong past profitability ensures a stable future.
- For a company with high quality earnings and an attractive dividend, the risk lies in whether declining fundamentals might force changes to shareholder returns or further erode investor confidence.
See our latest analysis for Electric Power Development.
Next Steps
Don't just look at this quarter; the real story is in the long-term trend. We've done an in-depth analysis on Electric Power Development's growth and its valuation to see if today's price is a bargain. Add the company to your watchlist or portfolio now so you don't miss the next big move.
See What Else Is Out There
Electric Power Development’s projected declines in both earnings and revenue highlight a risk that its impressive historical growth may not be repeated in the years ahead.
If you’re seeking more steady and resilient performers, use our stable growth stocks screener (2087 results) to discover companies that consistently deliver reliable growth through shifting market conditions.
This article by Simply Wall St is general in nature. We provide commentary based on historical data and analyst forecasts only using an unbiased methodology and our articles are not intended to be financial advice. It does not constitute a recommendation to buy or sell any stock, and does not take account of your objectives, or your financial situation. We aim to bring you long-term focused analysis driven by fundamental data. Note that our analysis may not factor in the latest price-sensitive company announcements or qualitative material. Simply Wall St has no position in any stocks mentioned.
Valuation is complex, but we're here to simplify it.
Discover if Electric Power Development might be undervalued or overvalued with our detailed analysis, featuring fair value estimates, potential risks, dividends, insider trades, and its financial condition.
Access Free AnalysisHave feedback on this article? Concerned about the content? Get in touch with us directly. Alternatively, email editorial-team@simplywallst.com
About TSE:9513
Electric Power Development
Operates as electric utility company in Japan.
Established dividend payer and fair value.
Market Insights

Advertisement
Community Narratives
The company that turned a verb into a global necessity and basically runs the modern internet, digital ads, smartphones, maps, and AI.
Fair Value US$300.00|6.3% undervalued
OS
Community Contributor
Flowers Foods Pays A Fair Price For Health
Fair Value US$16.12|26.0% undervalued
NV
Community Contributor
TMX Group will thrive with 33.3% profit margin and enduring market moat
Fair Value CA$49.90|3.7% overvalued
LI
Community Contributor