
Advertisement
- Japan
- /
- Electric Utilities
- /
- TSE:9507
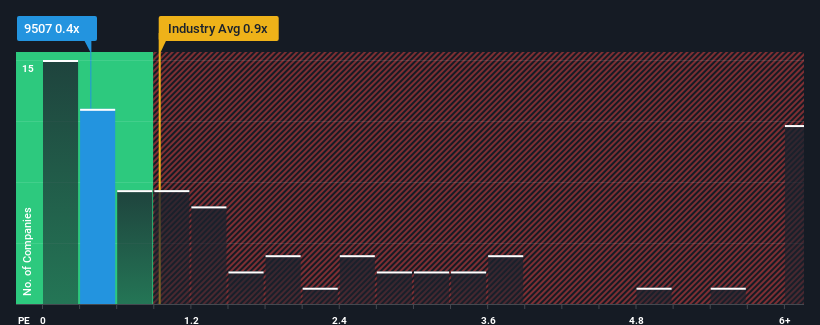
What You Can Learn From Shikoku Electric Power Company, Incorporated's (TSE:9507) P/S
There wouldn't be many who think Shikoku Electric Power Company, Incorporated's (TSE:9507) price-to-sales (or "P/S") ratio of 0.4x is worth a mention when the median P/S for the Electric Utilities industry in Japan is similar at about 0.3x. While this might not raise any eyebrows, if the P/S ratio is not justified investors could be missing out on a potential opportunity or ignoring looming disappointment.
See our latest analysis for Shikoku Electric Power Company
How Has Shikoku Electric Power Company Performed Recently?
There hasn't been much to differentiate Shikoku Electric Power Company's and the industry's retreating revenue lately. Perhaps the market is expecting future revenue performance to continue matching the industry, which has kept the P/S in line with expectations. You'd much rather the company improve its revenue if you still believe in the business. In saying that, existing shareholders probably aren't too pessimistic about the share price if the company's revenue continues tracking the industry.
Want the full picture on analyst estimates for the company? Then our free report on Shikoku Electric Power Company will help you uncover what's on the horizon.What Are Revenue Growth Metrics Telling Us About The P/S?
Shikoku Electric Power Company's P/S ratio would be typical for a company that's only expected to deliver moderate growth, and importantly, perform in line with the industry.
In reviewing the last year of financials, we were disheartened to see the company's revenues fell to the tune of 5.5%. This has soured the latest three-year period, which nevertheless managed to deliver a decent 9.5% overall rise in revenue. So we can start by confirming that the company has generally done a good job of growing revenue over that time, even though it had some hiccups along the way.
Turning to the outlook, the next three years should bring diminished returns, with revenue decreasing 0.4% per annum as estimated by the four analysts watching the company. Meanwhile, the industry is forecast to moderate by 0.6% each year, which suggests the company won't escape the wider industry forces.
With this information, it's not too hard to see why Shikoku Electric Power Company is trading at a fairly similar P/S in comparison. Nonetheless, with revenue going in reverse, it's not guaranteed that the P/S has found a floor yet. Maintaining these prices will be difficult to achieve as the weak outlook is likely to weigh down the shares eventually.
The Key Takeaway
While the price-to-sales ratio shouldn't be the defining factor in whether you buy a stock or not, it's quite a capable barometer of revenue expectations.
Our findings align with our suspicions - a closer look at Shikoku Electric Power Company's analyst forecasts shows that the company's similarly unstable outlook compared to the industry is keeping its price-to-sales ratio in line with the industry's average. Right now, shareholders are comfortable with the P/S as they have faith that future revenue will not uncover any unpleasant surprises. However, we're slightly cautious about the company's ability to resist further pain to its business from the broader industry turmoil. For now though, it's hard to see the share price moving strongly in either direction in the near future under these circumstances.
You need to take note of risks, for example - Shikoku Electric Power Company has 3 warning signs (and 2 which can't be ignored) we think you should know about.
It's important to make sure you look for a great company, not just the first idea you come across. So if growing profitability aligns with your idea of a great company, take a peek at this free list of interesting companies with strong recent earnings growth (and a low P/E).
New: Manage All Your Stock Portfolios in One Place
We've created the ultimate portfolio companion for stock investors, and it's free.
• Connect an unlimited number of Portfolios and see your total in one currency
• Be alerted to new Warning Signs or Risks via email or mobile
• Track the Fair Value of your stocks
Have feedback on this article? Concerned about the content? Get in touch with us directly. Alternatively, email editorial-team (at) simplywallst.com.
This article by Simply Wall St is general in nature. We provide commentary based on historical data and analyst forecasts only using an unbiased methodology and our articles are not intended to be financial advice. It does not constitute a recommendation to buy or sell any stock, and does not take account of your objectives, or your financial situation. We aim to bring you long-term focused analysis driven by fundamental data. Note that our analysis may not factor in the latest price-sensitive company announcements or qualitative material. Simply Wall St has no position in any stocks mentioned.
About TSE:9507
Shikoku Electric Power Company
Shikoku Electric Power Company engages in generating, transmitting, distributing, and selling electricity in Japan and internationally.
Proven track record average dividend payer.
Market Insights

Advertisement
Community Narratives
MicroVision will explode future revenue by 380.37% with a vision towards success
Fair Value US$60.00|98.5% undervalued
TH
Community Contributor
The Indispensable Artery for a New North American Economy
Fair Value CA$132.87|2.3% undervalued
TI
Community Contributor