Advertisement
SENKO Group Holdings (TSE:9069) Valuation in Focus After Lower Profit Forecast and Higher Interim Dividend

Simply Wall St
Reviewed by Simply Wall St
SENKO Group Holdings (TSE:9069) updated investors with a mixed set of developments, as it lowered full-year profit guidance while at the same time announcing a higher interim dividend for shareholders. These announcements followed a recent board meeting.
See our latest analysis for SENKO Group Holdings.
After a string of acquisition-driven gains and expanded sales efforts, SENKO Group Holdings' 1-day share price return of 1.6% suggests investors are reacting positively to its new dividend announcement, despite the lower profit outlook. Looking at the bigger picture, the company has delivered a robust 26.3% total shareholder return over the past year, and an impressive 101% three-year total return. This reflects strong long-term momentum even as short-term share price swings have lately been turbulent.
If recent profit guidance revisions have you curious about what else is moving, this is an ideal moment to broaden your search and discover fast growing stocks with high insider ownership
With SENKO Group Holdings lowering profit guidance while boosting dividends, the key question is whether shares now offer hidden value or if the market has already priced in the company’s prospects for future growth.
Price-to-Earnings of 19x: Is it justified?
SENKO Group Holdings trades at a price-to-earnings (P/E) ratio of 19x, which is significantly higher than the average for its direct peers. The last close price of ¥1,868 places it in the expensive camp compared to both peer and industry benchmarks.
The price-to-earnings ratio is a commonly used valuation metric that shows how much investors are willing to pay for each yen of current earnings. For logistics companies, a premium P/E can reflect anticipated growth or operational strengths.
The company's 19x multiple stands out against the JP Logistics industry average P/E of 13.6x, as well as the peer group’s 18.6x. Looking deeper, the estimated fair P/E for SENKO Group Holdings is 16.6x, suggesting further downside if the market corrects toward the typical level seen in the sector.
Explore the SWS fair ratio for SENKO Group Holdings
Result: Price-to-Earnings of 19x (OVERVALUED)
However, slowing revenue growth and a price already near analyst targets could limit upside if profits disappoint or if market conditions worsen.
Find out about the key risks to this SENKO Group Holdings narrative.
Another View: What Does the SWS DCF Model Say?
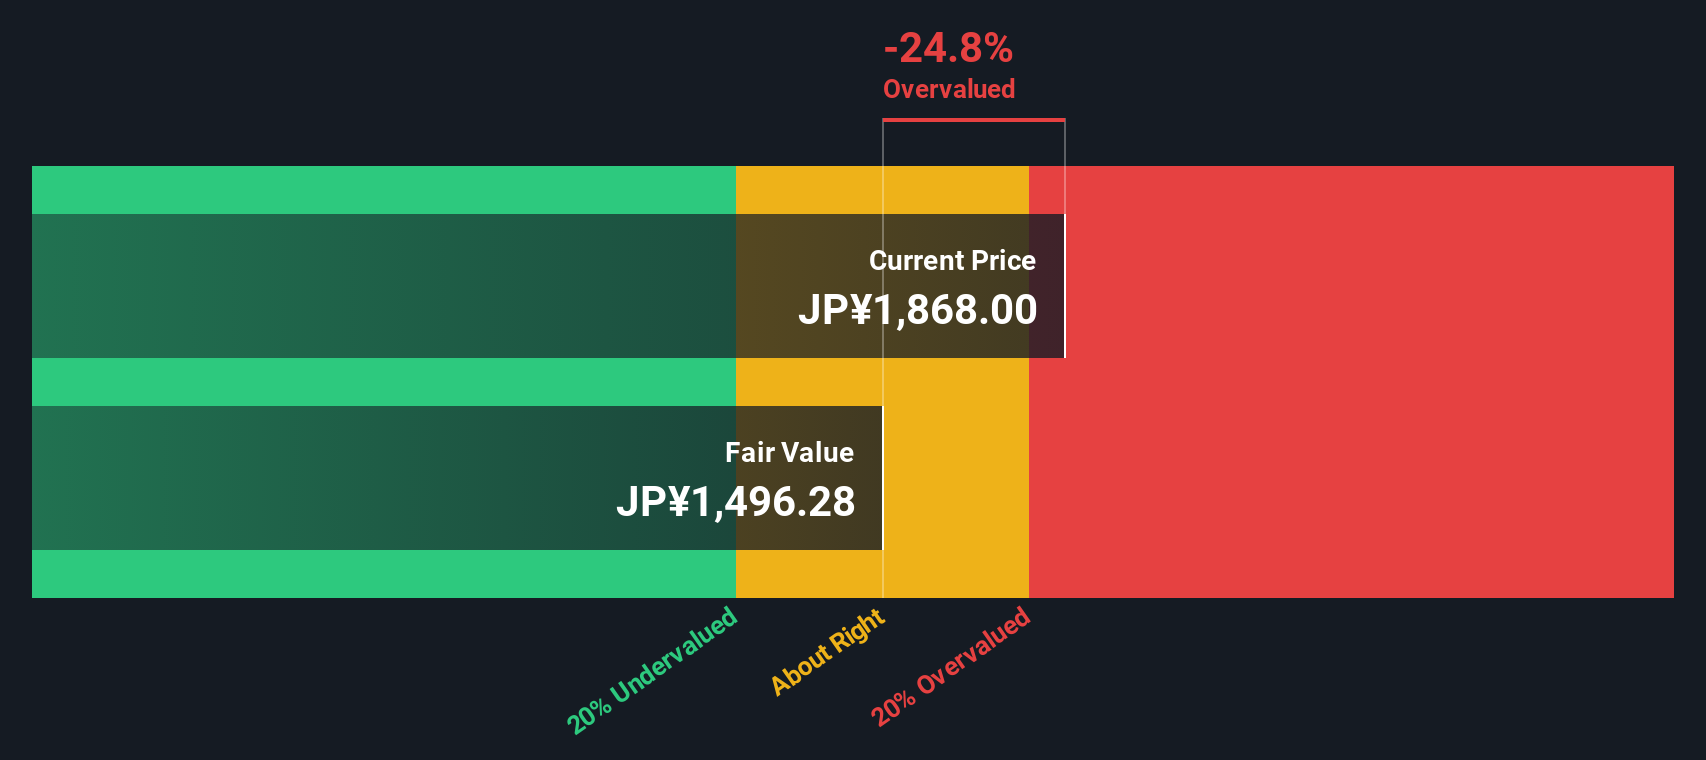
While the current price-to-earnings ratio points to shares being expensive, our DCF model offers a different perspective. According to the SWS DCF model, SENKO Group Holdings trades above its estimated fair value, indicating limited upside from this angle as well. Could the company's growth story justify this premium?
Look into how the SWS DCF model arrives at its fair value.
Simply Wall St performs a discounted cash flow (DCF) on every stock in the world every day (check out SENKO Group Holdings for example). We show the entire calculation in full. You can track the result in your watchlist or portfolio and be alerted when this changes, or use our stock screener to discover 917 undervalued stocks based on their cash flows. If you save a screener we even alert you when new companies match - so you never miss a potential opportunity.
Build Your Own SENKO Group Holdings Narrative
If our analysis does not entirely align with your thinking or you prefer hands-on research, you can easily build your own view in minutes. Do it your way
A great starting point for your SENKO Group Holdings research is our analysis highlighting 1 key reward and 2 important warning signs that could impact your investment decision.
Looking for more investment ideas?
Don’t let great opportunities pass you by. Uncover unique investment angles and fresh growth stories now. Your next winning stock could be just a click away.
- Tap into future-defining tech with these 25 AI penny stocks to see which innovators stand out as AI gains momentum.
- Unlock consistent yield potential by checking out these 17 dividend stocks with yields > 3%, which offers attractive payouts for reliable income seekers.
- Catch sectors flying under the radar by scanning these 30 healthcare AI stocks, where cutting-edge medical advancements meet artificial intelligence.
This article by Simply Wall St is general in nature. We provide commentary based on historical data and analyst forecasts only using an unbiased methodology and our articles are not intended to be financial advice. It does not constitute a recommendation to buy or sell any stock, and does not take account of your objectives, or your financial situation. We aim to bring you long-term focused analysis driven by fundamental data. Note that our analysis may not factor in the latest price-sensitive company announcements or qualitative material. Simply Wall St has no position in any stocks mentioned.
New: Manage All Your Stock Portfolios in One Place
We've created the ultimate portfolio companion for stock investors, and it's free.
• Connect an unlimited number of Portfolios and see your total in one currency
• Be alerted to new Warning Signs or Risks via email or mobile
• Track the Fair Value of your stocks
Have feedback on this article? Concerned about the content? Get in touch with us directly. Alternatively, email editorial-team@simplywallst.com
About TSE:9069
Average dividend payer with moderate growth potential.
Market Insights

Advertisement
Community Narratives
MicroVision will explode future revenue by 380.37% with a vision towards success
Fair Value US$60.00|98.4% undervalued
TH
Community Contributor
The Indispensable Artery for a New North American Economy
Fair Value CA$132.87|1.3% undervalued
TI
Community Contributor