Stock Analysis
Sankyu Inc.'s (TSE:9065) Fundamentals Look Pretty Strong: Could The Market Be Wrong About The Stock?


With its stock down 3.2% over the past week, it is easy to disregard Sankyu (TSE:9065). However, the company's fundamentals look pretty decent, and long-term financials are usually aligned with future market price movements. In this article, we decided to focus on Sankyu's ROE.
ROE or return on equity is a useful tool to assess how effectively a company can generate returns on the investment it received from its shareholders. In other words, it is a profitability ratio which measures the rate of return on the capital provided by the company's shareholders.
See our latest analysis for Sankyu
How To Calculate Return On Equity?
The formula for return on equity is:
Return on Equity = Net Profit (from continuing operations) ÷ Shareholders' Equity
So, based on the above formula, the ROE for Sankyu is:
8.6% = JP¥25b ÷ JP¥285b (Based on the trailing twelve months to March 2024).
The 'return' is the yearly profit. So, this means that for every ¥1 of its shareholder's investments, the company generates a profit of ¥0.09.
Why Is ROE Important For Earnings Growth?
So far, we've learned that ROE is a measure of a company's profitability. Depending on how much of these profits the company reinvests or "retains", and how effectively it does so, we are then able to assess a company’s earnings growth potential. Assuming all else is equal, companies that have both a higher return on equity and higher profit retention are usually the ones that have a higher growth rate when compared to companies that don't have the same features.
Sankyu's Earnings Growth And 8.6% ROE
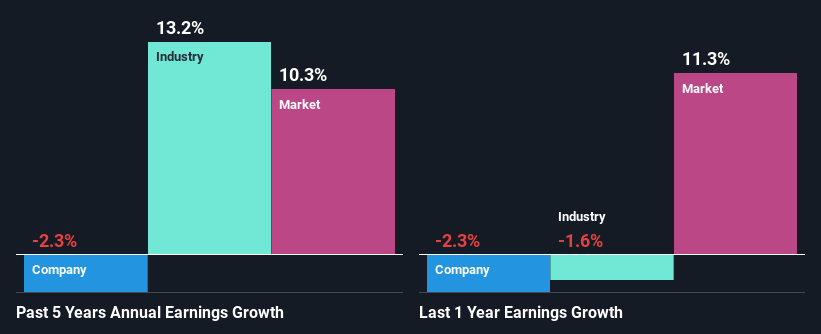
To begin with, Sankyu seems to have a respectable ROE. And on comparing with the industry, we found that the the average industry ROE is similar at 8.6%. However, while Sankyu has a pretty respectable ROE, its five year net income decline rate was 2.3% . So, there might be some other aspects that could explain this. These include low earnings retention or poor allocation of capital.
So, as a next step, we compared Sankyu's performance against the industry and were disappointed to discover that while the company has been shrinking its earnings, the industry has been growing its earnings at a rate of 13% over the last few years.
Earnings growth is a huge factor in stock valuation. The investor should try to establish if the expected growth or decline in earnings, whichever the case may be, is priced in. This then helps them determine if the stock is placed for a bright or bleak future. One good indicator of expected earnings growth is the P/E ratio which determines the price the market is willing to pay for a stock based on its earnings prospects. So, you may want to check if Sankyu is trading on a high P/E or a low P/E, relative to its industry.
Is Sankyu Efficiently Re-investing Its Profits?
Despite having a normal three-year median payout ratio of 30% (where it is retaining 70% of its profits), Sankyu has seen a decline in earnings as we saw above. It looks like there might be some other reasons to explain the lack in that respect. For example, the business could be in decline.
In addition, Sankyu has been paying dividends over a period of at least ten years suggesting that keeping up dividend payments is way more important to the management even if it comes at the cost of business growth.
Summary
Overall, we feel that Sankyu certainly does have some positive factors to consider. Yet, the low earnings growth is a bit concerning, especially given that the company has a high rate of return and is reinvesting ma huge portion of its profits. By the looks of it, there could be some other factors, not necessarily in control of the business, that's preventing growth. With that said, we studied the latest analyst forecasts and found that while the company has shrunk its earnings in the past, analysts expect its earnings to grow in the future. To know more about the latest analysts predictions for the company, check out this visualization of analyst forecasts for the company.
Valuation is complex, but we're helping make it simple.
Find out whether Sankyu is potentially over or undervalued by checking out our comprehensive analysis, which includes fair value estimates, risks and warnings, dividends, insider transactions and financial health.
View the Free AnalysisHave feedback on this article? Concerned about the content? Get in touch with us directly. Alternatively, email editorial-team (at) simplywallst.com.
This article by Simply Wall St is general in nature. We provide commentary based on historical data and analyst forecasts only using an unbiased methodology and our articles are not intended to be financial advice. It does not constitute a recommendation to buy or sell any stock, and does not take account of your objectives, or your financial situation. We aim to bring you long-term focused analysis driven by fundamental data. Note that our analysis may not factor in the latest price-sensitive company announcements or qualitative material. Simply Wall St has no position in any stocks mentioned.
Valuation is complex, but we're helping make it simple.
Find out whether Sankyu is potentially over or undervalued by checking out our comprehensive analysis, which includes fair value estimates, risks and warnings, dividends, insider transactions and financial health.
View the Free AnalysisHave feedback on this article? Concerned about the content? Get in touch with us directly. Alternatively, email editorial-team@simplywallst.com
About TSE:9065
Excellent balance sheet average dividend payer.
