Advertisement
- Japan
- /
- Transportation
- /
- TSE:9024
Seibu Holdings (TSE:9024) Valuation in Focus After Recognizing Extraordinary Income from Asset Transfer

Simply Wall St
Reviewed by Simply Wall St
Seibu Holdings (TSE:9024) just held a board meeting focused on recognizing extraordinary income from a subsidiary's transfer of non-current assets. Moves like this can catch investors’ attention, especially because they may affect future earnings results.
See our latest analysis for Seibu Holdings.
With Seibu Holdings notching an impressive 63% share price return year to date and a stellar 401% five-year total shareholder return, momentum is clearly on the investor's side. Recent market optimism, fueled by news of extraordinary income, is reinforcing a rapid long-term growth narrative.
If this kind of financial turnaround has caught your attention, now is a perfect opportunity to broaden your search and explore fast growing stocks with high insider ownership
But with shares already surging and trading above analyst targets, the real question becomes whether Seibu Holdings is undervalued and poised for further gains, or if today’s prices fully reflect its future prospects.
Price-to-Earnings of 5.4x: Is it justified?
Seibu Holdings currently trades at a price-to-earnings (P/E) ratio of 5.4x, which is well below both peer and industry averages. This is the case even after the recent share price surge. As a result, the stock appears inexpensive on a surface level compared to its sector peers.
The price-to-earnings ratio shows how much investors are willing to pay for each yen of the company’s earnings. For Seibu Holdings, this measure is particularly relevant after a year marked by notable earnings growth. However, the unusually low P/E may indicate that investors expect future challenges or consider current profits difficult to maintain.
When compared with the broader JP Transportation industry average of 12.5x, Seibu Holdings appears undervalued from a multiples perspective. Even when using a fair P/E estimate of 4.9x, the current multiple is only slightly higher. This level could attract price movement if the market adjusts the stock closer to its assessed earning power.
Explore the SWS fair ratio for Seibu Holdings
Result: Price-to-Earnings of 5.4x (UNDERVALUED)
However, Seibu Holdings faces key risks, including recent negative revenue and net income growth. These factors could challenge its current momentum if not reversed.
Find out about the key risks to this Seibu Holdings narrative.
Another View: What Does Our DCF Model Say?
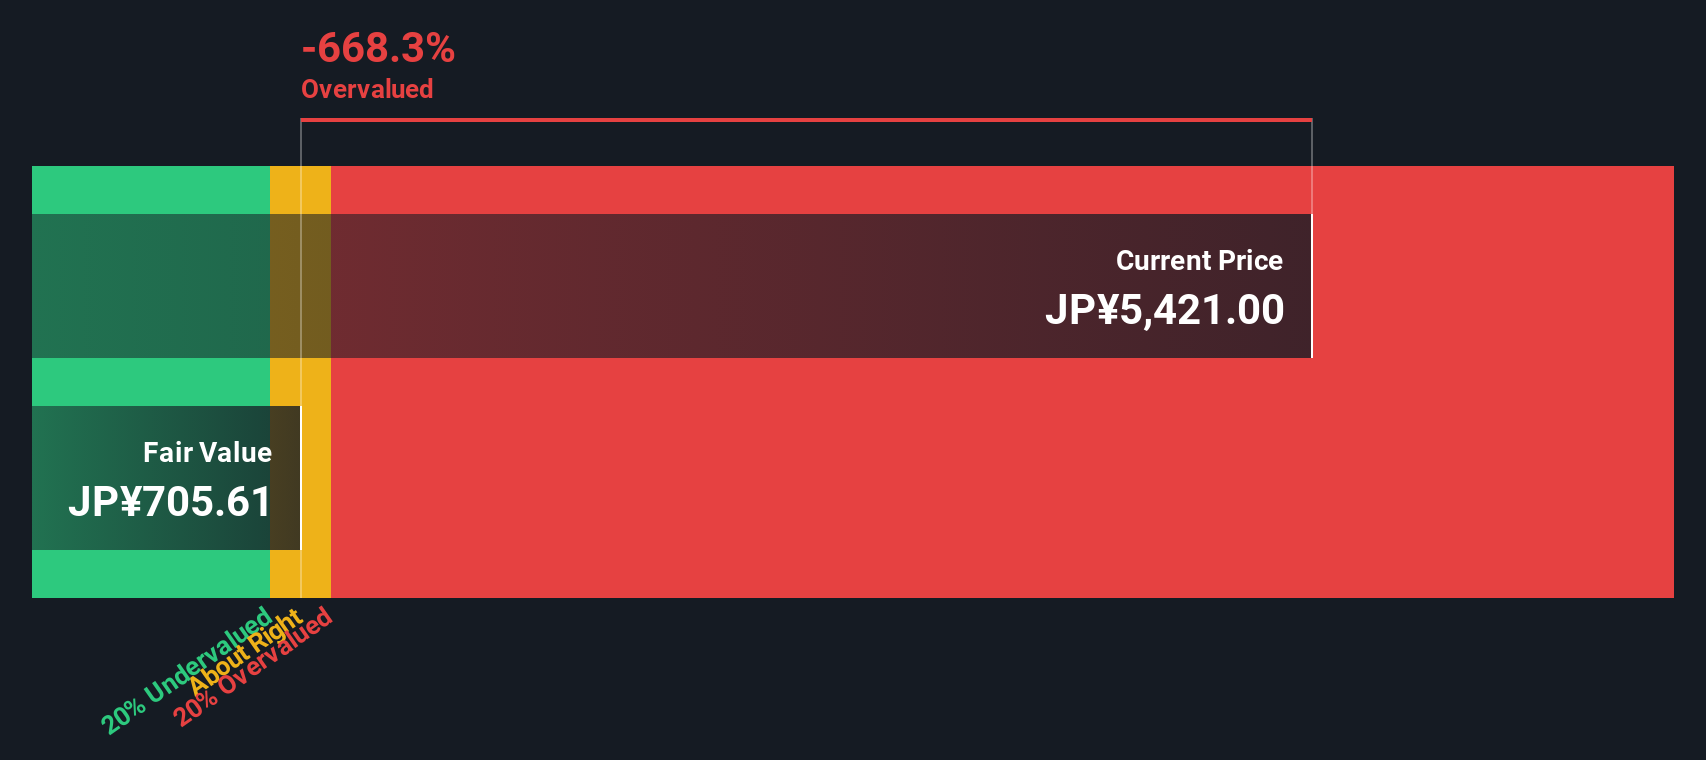
While the current P/E ratio makes Seibu Holdings look undervalued compared to peers, the SWS DCF model comes to the opposite conclusion. According to our DCF estimate, the company’s fair value is much lower than its market price, suggesting that shares may actually be overvalued at this level. Which view should investors trust when the signals diverge?
Look into how the SWS DCF model arrives at its fair value.
Simply Wall St performs a discounted cash flow (DCF) on every stock in the world every day (check out Seibu Holdings for example). We show the entire calculation in full. You can track the result in your watchlist or portfolio and be alerted when this changes, or use our stock screener to discover 848 undervalued stocks based on their cash flows. If you save a screener we even alert you when new companies match - so you never miss a potential opportunity.
Build Your Own Seibu Holdings Narrative
If your perspective differs or you want to dig deeper into the numbers yourself, you can shape your own view in just a few minutes, starting with Do it your way.
A great starting point for your Seibu Holdings research is our analysis highlighting 2 key rewards and 3 important warning signs that could impact your investment decision.
Looking for More Smart Investment Ideas?
Why stop at just one opportunity? You can take advantage of more of what the market has to offer by using Simply Wall Street’s screeners to guide you toward your next pick.
- Benefit from consistent payouts by checking out these 24 dividend stocks with yields > 3%, which offers yields above 3% for reliable income.
- Capitalize on cutting-edge breakthroughs by searching through these 26 AI penny stocks focused on artificial intelligence and digital innovation.
- Explore the latest trends in digital finance by reviewing these 81 cryptocurrency and blockchain stocks if you want exposure to cryptocurrencies and blockchain technology.
This article by Simply Wall St is general in nature. We provide commentary based on historical data and analyst forecasts only using an unbiased methodology and our articles are not intended to be financial advice. It does not constitute a recommendation to buy or sell any stock, and does not take account of your objectives, or your financial situation. We aim to bring you long-term focused analysis driven by fundamental data. Note that our analysis may not factor in the latest price-sensitive company announcements or qualitative material. Simply Wall St has no position in any stocks mentioned.
New: Manage All Your Stock Portfolios in One Place
We've created the ultimate portfolio companion for stock investors, and it's free.
• Connect an unlimited number of Portfolios and see your total in one currency
• Be alerted to new Warning Signs or Risks via email or mobile
• Track the Fair Value of your stocks
Have feedback on this article? Concerned about the content? Get in touch with us directly. Alternatively, email editorial-team@simplywallst.com
About TSE:9024
Seibu Holdings
Engages in the urban transportation, hotel and leisure, real estate, construction, and baseball team management businesses in Japan and internationally.
Proven track record with mediocre balance sheet.
Market Insights

Advertisement
Community Narratives
The company that turned a verb into a global necessity and basically runs the modern internet, digital ads, smartphones, maps, and AI.
Fair Value US$300.00|6.2% undervalued
OS
Community Contributor
Flowers Foods Pays A Fair Price For Health
Fair Value US$16.12|25.1% undervalued
NV
Community Contributor
TMX Group will thrive with 33.3% profit margin and enduring market moat
Fair Value CA$49.90|0.04% overvalued
LI
Community Contributor