Advertisement
- Japan
- /
- Transportation
- /
- TSE:9023
Tokyo Metro (TSE:9023): Evaluating Valuation After New Earnings Guidance and Half-Year Update

Simply Wall St
Reviewed by Simply Wall St
Tokyo Metro (TSE:9023) released its consolidated earnings guidance for the fiscal year ending March 2026, projecting operating revenue of ¥420,600 million and profit attributable to owners of parent at ¥58,200 million. This guidance was announced alongside the company’s half-year earnings call, signaling key updates for investors.
See our latest analysis for Tokyo Metro.
After sharing its new earnings guidance and half-year update, Tokyo Metro’s stock is showing signs of resilience. The latest share price closed at ¥1,629, with a 2.08% total shareholder return over the past year. Recent announcements have helped steady sentiment and are highlighting stable momentum as investors weigh long-term growth potential against steady fundamentals.
If you’re curious what other companies are capturing market attention lately, now is the perfect time to broaden your search and discover fast growing stocks with high insider ownership
With Tokyo Metro’s latest results and outlook now on the table, investors are left pondering a familiar question: Is the current share price leaving room for further upside, or is future growth already factored in?
Price-to-Earnings of 16.3x: Is it justified?
At the last close of ¥1,629, Tokyo Metro is trading at a price-to-earnings (P/E) ratio of 16.3 times, which is well above key benchmarks. This valuation stands out sharply against both industry and peer comparisons.
The price-to-earnings ratio reflects how much investors are willing to pay for each yen of current earnings. It is especially relevant for mature transportation companies like Tokyo Metro, where stable income and profit trends often command more modest multiples.
Yet, at 16.3x, Tokyo Metro’s P/E is notably higher than the Japanese Transportation industry average of 12.4x, as well as the peer group average of just 10.7x. Even when looking at the estimated fair ratio of 15.3x, the market premium seems difficult to ignore and could suggest expectations of outsized profitability or robust earnings continuity. Investors should be mindful of how far the valuation may deviate from long-term sector norms, and whether earnings can keep up with the premium.
Explore the SWS fair ratio for Tokyo Metro
Result: Price-to-Earnings of 16.3x (OVERVALUED)
However, persistent slowdowns in revenue or profit growth, or an unexpected dip in market sentiment, could quickly challenge the current valuation premium.
Find out about the key risks to this Tokyo Metro narrative.
Another View: What Does the SWS DCF Model Suggest?
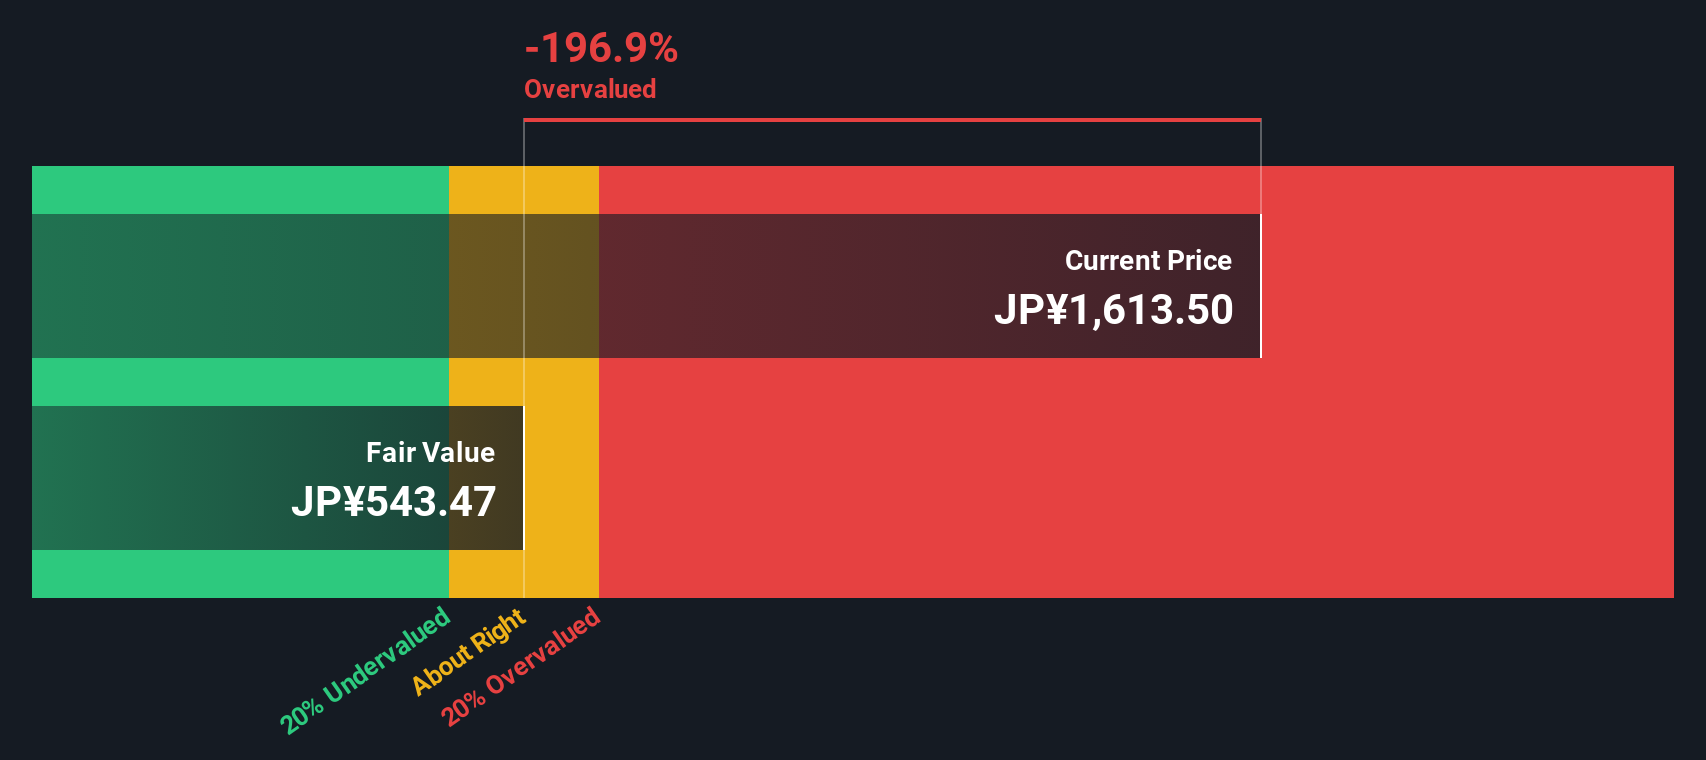
While the price-to-earnings ratio portrays Tokyo Metro as expensive compared to its peers, our SWS DCF model offers a different perspective. According to this discounted cash flow approach, the share price of ¥1,629 is well above the model’s estimate of fair value at ¥603.69, suggesting the stock may be overvalued by this metric. Does this second method give investors reason to pause, or is the market seeing something the model cannot?
Look into how the SWS DCF model arrives at its fair value.
Simply Wall St performs a discounted cash flow (DCF) on every stock in the world every day (check out Tokyo Metro for example). We show the entire calculation in full. You can track the result in your watchlist or portfolio and be alerted when this changes, or use our stock screener to discover 841 undervalued stocks based on their cash flows. If you save a screener we even alert you when new companies match - so you never miss a potential opportunity.
Build Your Own Tokyo Metro Narrative
If you think the numbers tell a different story or would rather build your own perspective, you can create a narrative yourself in just a few minutes. Do it your way
A great starting point for your Tokyo Metro research is our analysis highlighting 2 key rewards and 2 important warning signs that could impact your investment decision.
Looking for More Actionable Investment Ideas?
Smart investors always have their radar up. Uncover fresh opportunities now with these tailored stock screens. Don’t miss out while the market moves fast.
- Fuel your income strategy by tapping into steady cash flow from these 20 dividend stocks with yields > 3% with yields above 3%.
- Capture the upside in artificial intelligence by screening for innovation leaders among these 26 AI penny stocks making headlines in tomorrow’s technology.
- Jump ahead on hidden gems trading at attractive prices with these 841 undervalued stocks based on cash flows based on robust cash flows and valuation signals.
This article by Simply Wall St is general in nature. We provide commentary based on historical data and analyst forecasts only using an unbiased methodology and our articles are not intended to be financial advice. It does not constitute a recommendation to buy or sell any stock, and does not take account of your objectives, or your financial situation. We aim to bring you long-term focused analysis driven by fundamental data. Note that our analysis may not factor in the latest price-sensitive company announcements or qualitative material. Simply Wall St has no position in any stocks mentioned.
Valuation is complex, but we're here to simplify it.
Discover if Tokyo Metro might be undervalued or overvalued with our detailed analysis, featuring fair value estimates, potential risks, dividends, insider trades, and its financial condition.
Access Free AnalysisHave feedback on this article? Concerned about the content? Get in touch with us directly. Alternatively, email editorial-team@simplywallst.com
About TSE:9023
Tokyo Metro
Engages in the operation and management of railways in Japan.
Proven track record with imperfect balance sheet.
Market Insights

Advertisement
Community Narratives
The company that turned a verb into a global necessity and basically runs the modern internet, digital ads, smartphones, maps, and AI.
Fair Value US$300.00|7.5% undervalued
OS
Community Contributor
Flowers Foods Pays A Fair Price For Health
Fair Value US$16.12|25.4% undervalued
NV
Community Contributor
TMX Group will thrive with 33.3% profit margin and enduring market moat
Fair Value CA$49.90|3.6% overvalued
LI
Community Contributor
The "Molecular Pencil": Why Beam's Technology is Built to Win
Fair Value US$65.01|65.0% undervalued
DA
Community Contributor