
Advertisement
- Japan
- /
- Transportation
- /
- TSE:9009
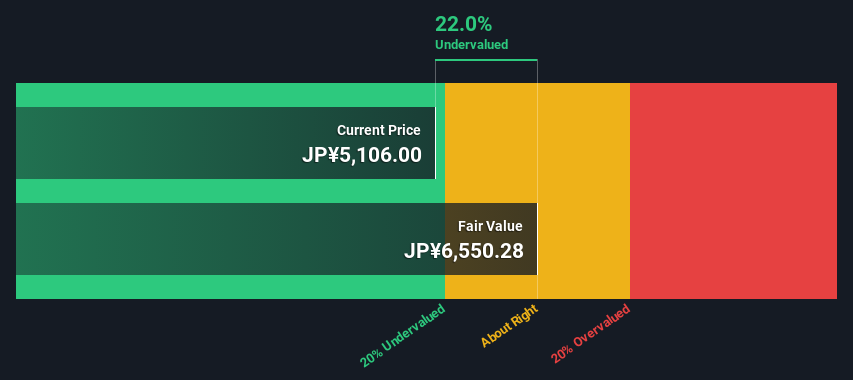
Keisei Electric Railway Co., Ltd. (TSE:9009) Shares Could Be 22% Below Their Intrinsic Value Estimate
Key Insights
- Keisei Electric Railway's estimated fair value is JP¥6,550 based on 2 Stage Free Cash Flow to Equity
- Keisei Electric Railway is estimated to be 22% undervalued based on current share price of JP¥5,106
- The JP¥5,638 analyst price target for 9009 is 14% less than our estimate of fair value
How far off is Keisei Electric Railway Co., Ltd. (TSE:9009) from its intrinsic value? Using the most recent financial data, we'll take a look at whether the stock is fairly priced by projecting its future cash flows and then discounting them to today's value. One way to achieve this is by employing the Discounted Cash Flow (DCF) model. Believe it or not, it's not too difficult to follow, as you'll see from our example!
We generally believe that a company's value is the present value of all of the cash it will generate in the future. However, a DCF is just one valuation metric among many, and it is not without flaws. If you want to learn more about discounted cash flow, the rationale behind this calculation can be read in detail in the Simply Wall St analysis model.
Check out our latest analysis for Keisei Electric Railway
The Model
We are going to use a two-stage DCF model, which, as the name states, takes into account two stages of growth. The first stage is generally a higher growth period which levels off heading towards the terminal value, captured in the second 'steady growth' period. To begin with, we have to get estimates of the next ten years of cash flows. Where possible we use analyst estimates, but when these aren't available we extrapolate the previous free cash flow (FCF) from the last estimate or reported value. We assume companies with shrinking free cash flow will slow their rate of shrinkage, and that companies with growing free cash flow will see their growth rate slow, over this period. We do this to reflect that growth tends to slow more in the early years than it does in later years.
A DCF is all about the idea that a dollar in the future is less valuable than a dollar today, and so the sum of these future cash flows is then discounted to today's value:
10-year free cash flow (FCF) forecast
| 2025 | 2026 | 2027 | 2028 | 2029 | 2030 | 2031 | 2032 | 2033 | 2034 | |
| Levered FCF (¥, Millions) | -JP¥30.9b | JP¥17.6b | JP¥34.6b | JP¥46.8b | JP¥58.4b | JP¥68.6b | JP¥76.9b | JP¥83.6b | JP¥88.7b | JP¥92.5b |
| Growth Rate Estimate Source | Analyst x1 | Analyst x3 | Analyst x1 | Est @ 35.28% | Est @ 24.76% | Est @ 17.39% | Est @ 12.23% | Est @ 8.62% | Est @ 6.10% | Est @ 4.33% |
| Present Value (¥, Millions) Discounted @ 6.8% | -JP¥28.9k | JP¥15.5k | JP¥28.4k | JP¥36.0k | JP¥42.1k | JP¥46.2k | JP¥48.6k | JP¥49.4k | JP¥49.1k | JP¥48.0k |
("Est" = FCF growth rate estimated by Simply Wall St)
Present Value of 10-year Cash Flow (PVCF) = JP¥334b
After calculating the present value of future cash flows in the initial 10-year period, we need to calculate the Terminal Value, which accounts for all future cash flows beyond the first stage. The Gordon Growth formula is used to calculate Terminal Value at a future annual growth rate equal to the 5-year average of the 10-year government bond yield of 0.2%. We discount the terminal cash flows to today's value at a cost of equity of 6.8%.
Terminal Value (TV)= FCF2034 × (1 + g) ÷ (r – g) = JP¥93b× (1 + 0.2%) ÷ (6.8%– 0.2%) = JP¥1.4t
Present Value of Terminal Value (PVTV)= TV / (1 + r)10= JP¥1.4t÷ ( 1 + 6.8%)10= JP¥730b
The total value is the sum of cash flows for the next ten years plus the discounted terminal value, which results in the Total Equity Value, which in this case is JP¥1.1t. To get the intrinsic value per share, we divide this by the total number of shares outstanding. Relative to the current share price of JP¥5.1k, the company appears a touch undervalued at a 22% discount to where the stock price trades currently. Remember though, that this is just an approximate valuation, and like any complex formula - garbage in, garbage out.
The Assumptions
The calculation above is very dependent on two assumptions. The first is the discount rate and the other is the cash flows. Part of investing is coming up with your own evaluation of a company's future performance, so try the calculation yourself and check your own assumptions. The DCF also does not consider the possible cyclicality of an industry, or a company's future capital requirements, so it does not give a full picture of a company's potential performance. Given that we are looking at Keisei Electric Railway as potential shareholders, the cost of equity is used as the discount rate, rather than the cost of capital (or weighted average cost of capital, WACC) which accounts for debt. In this calculation we've used 6.8%, which is based on a levered beta of 1.169. Beta is a measure of a stock's volatility, compared to the market as a whole. We get our beta from the industry average beta of globally comparable companies, with an imposed limit between 0.8 and 2.0, which is a reasonable range for a stable business.
SWOT Analysis for Keisei Electric Railway
Strength
- Earnings growth over the past year exceeded the industry.
- Debt is well covered by earnings.
Weakness
- Dividend is low compared to the top 25% of dividend payers in the Transportation market.
Opportunity
- Good value based on P/E ratio and estimated fair value.
Threat
- Debt is not well covered by operating cash flow.
- Annual earnings are forecast to decline for the next 3 years.
Looking Ahead:
Whilst important, the DCF calculation ideally won't be the sole piece of analysis you scrutinize for a company. The DCF model is not a perfect stock valuation tool. Preferably you'd apply different cases and assumptions and see how they would impact the company's valuation. For instance, if the terminal value growth rate is adjusted slightly, it can dramatically alter the overall result. Why is the intrinsic value higher than the current share price? For Keisei Electric Railway, we've put together three pertinent factors you should further examine:
- Risks: Be aware that Keisei Electric Railway is showing 3 warning signs in our investment analysis , and 2 of those are concerning...
- Future Earnings: How does 9009's growth rate compare to its peers and the wider market? Dig deeper into the analyst consensus number for the upcoming years by interacting with our free analyst growth expectation chart.
- Other Solid Businesses: Low debt, high returns on equity and good past performance are fundamental to a strong business. Why not explore our interactive list of stocks with solid business fundamentals to see if there are other companies you may not have considered!
PS. The Simply Wall St app conducts a discounted cash flow valuation for every stock on the TSE every day. If you want to find the calculation for other stocks just search here.
Valuation is complex, but we're here to simplify it.
Discover if Keisei Electric Railway might be undervalued or overvalued with our detailed analysis, featuring fair value estimates, potential risks, dividends, insider trades, and its financial condition.
Access Free AnalysisHave feedback on this article? Concerned about the content? Get in touch with us directly. Alternatively, email editorial-team (at) simplywallst.com.
This article by Simply Wall St is general in nature. We provide commentary based on historical data and analyst forecasts only using an unbiased methodology and our articles are not intended to be financial advice. It does not constitute a recommendation to buy or sell any stock, and does not take account of your objectives, or your financial situation. We aim to bring you long-term focused analysis driven by fundamental data. Note that our analysis may not factor in the latest price-sensitive company announcements or qualitative material. Simply Wall St has no position in any stocks mentioned.
Have feedback on this article? Concerned about the content? Get in touch with us directly. Alternatively, email editorial-team@simplywallst.com
About TSE:9009
Keisei Electric Railway
Engages in the provision of public railway transportation services for local communities in Japan.
Good value with low risk.
Market Insights

Advertisement
Community Narratives
MicroVision will explode future revenue by 380.37% with a vision towards success
Fair Value US$60.00|98.3% undervalued
TH
Community Contributor
The Indispensable Artery for a New North American Economy
Fair Value CA$132.87|1.0% undervalued
TI
Community Contributor