
Advertisement
- Japan
- /
- Telecom Services and Carriers
- /
- TSE:9417
What Smartvalue Co., Ltd.'s (TSE:9417) 32% Share Price Gain Is Not Telling You
Smartvalue Co., Ltd. (TSE:9417) shareholders have had their patience rewarded with a 32% share price jump in the last month. Looking back a bit further, it's encouraging to see the stock is up 34% in the last year.
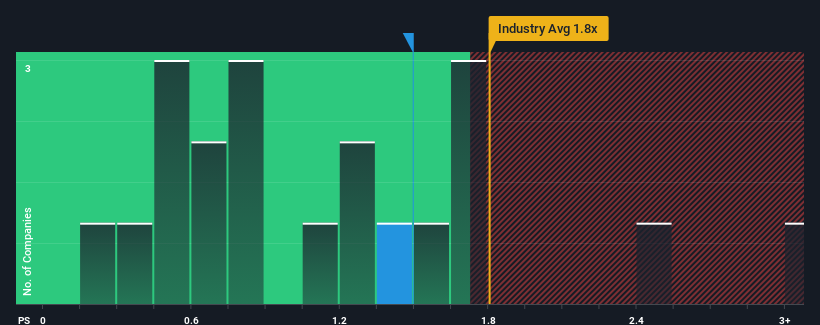
Since its price has surged higher, you could be forgiven for thinking Smartvalue is a stock not worth researching with a price-to-sales ratios (or "P/S") of 1.5x, considering almost half the companies in Japan's Telecom industry have P/S ratios below 1x. Although, it's not wise to just take the P/S at face value as there may be an explanation why it's as high as it is.
See our latest analysis for Smartvalue
What Does Smartvalue's Recent Performance Look Like?
For instance, Smartvalue's receding revenue in recent times would have to be some food for thought. It might be that many expect the company to still outplay most other companies over the coming period, which has kept the P/S from collapsing. If not, then existing shareholders may be quite nervous about the viability of the share price.
We don't have analyst forecasts, but you can see how recent trends are setting up the company for the future by checking out our free report on Smartvalue's earnings, revenue and cash flow.What Are Revenue Growth Metrics Telling Us About The High P/S?
In order to justify its P/S ratio, Smartvalue would need to produce impressive growth in excess of the industry.
Retrospectively, the last year delivered a frustrating 1.1% decrease to the company's top line. This means it has also seen a slide in revenue over the longer-term as revenue is down 3.3% in total over the last three years. So unfortunately, we have to acknowledge that the company has not done a great job of growing revenue over that time.
Weighing that medium-term revenue trajectory against the broader industry's one-year forecast for expansion of 2.7% shows it's an unpleasant look.
In light of this, it's alarming that Smartvalue's P/S sits above the majority of other companies. Apparently many investors in the company are way more bullish than recent times would indicate and aren't willing to let go of their stock at any price. Only the boldest would assume these prices are sustainable as a continuation of recent revenue trends is likely to weigh heavily on the share price eventually.
The Key Takeaway
Smartvalue shares have taken a big step in a northerly direction, but its P/S is elevated as a result. While the price-to-sales ratio shouldn't be the defining factor in whether you buy a stock or not, it's quite a capable barometer of revenue expectations.
We've established that Smartvalue currently trades on a much higher than expected P/S since its recent revenues have been in decline over the medium-term. With a revenue decline on investors' minds, the likelihood of a souring sentiment is quite high which could send the P/S back in line with what we'd expect. Should recent medium-term revenue trends persist, it would pose a significant risk to existing shareholders' investments and prospective investors will have a hard time accepting the current value of the stock.
It is also worth noting that we have found 3 warning signs for Smartvalue (2 shouldn't be ignored!) that you need to take into consideration.
Of course, profitable companies with a history of great earnings growth are generally safer bets. So you may wish to see this free collection of other companies that have reasonable P/E ratios and have grown earnings strongly.
New: Manage All Your Stock Portfolios in One Place
We've created the ultimate portfolio companion for stock investors, and it's free.
• Connect an unlimited number of Portfolios and see your total in one currency
• Be alerted to new Warning Signs or Risks via email or mobile
• Track the Fair Value of your stocks
Have feedback on this article? Concerned about the content? Get in touch with us directly. Alternatively, email editorial-team (at) simplywallst.com.
This article by Simply Wall St is general in nature. We provide commentary based on historical data and analyst forecasts only using an unbiased methodology and our articles are not intended to be financial advice. It does not constitute a recommendation to buy or sell any stock, and does not take account of your objectives, or your financial situation. We aim to bring you long-term focused analysis driven by fundamental data. Note that our analysis may not factor in the latest price-sensitive company announcements or qualitative material. Simply Wall St has no position in any stocks mentioned.
About TSE:9417
Acceptable track record with mediocre balance sheet.
Market Insights

Advertisement
Community Narratives
MicroVision will explode future revenue by 380.37% with a vision towards success
Fair Value US$60.00|98.4% undervalued
TH
Community Contributor
The Indispensable Artery for a New North American Economy
Fair Value CA$132.87|1.3% undervalued
TI
Community Contributor