
Advertisement
Some say volatility, rather than debt, is the best way to think about risk as an investor, but Warren Buffett famously said that 'Volatility is far from synonymous with risk.' When we think about how risky a company is, we always like to look at its use of debt, since debt overload can lead to ruin. We can see that Smartvalue Co., Ltd. (TSE:9417) does use debt in its business. But the real question is whether this debt is making the company risky.
Why Does Debt Bring Risk?
Debt and other liabilities become risky for a business when it cannot easily fulfill those obligations, either with free cash flow or by raising capital at an attractive price. Part and parcel of capitalism is the process of 'creative destruction' where failed businesses are mercilessly liquidated by their bankers. However, a more usual (but still expensive) situation is where a company must dilute shareholders at a cheap share price simply to get debt under control. By replacing dilution, though, debt can be an extremely good tool for businesses that need capital to invest in growth at high rates of return. When we examine debt levels, we first consider both cash and debt levels, together.
How Much Debt Does Smartvalue Carry?
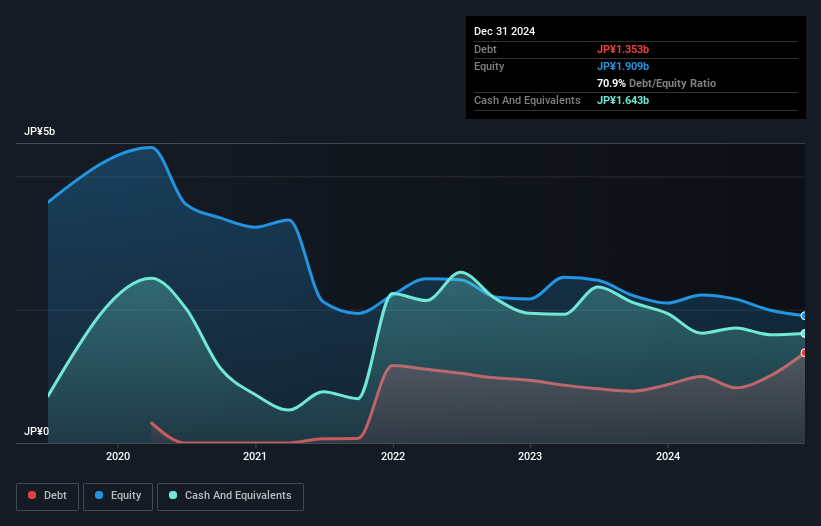
The image below, which you can click on for greater detail, shows that at December 2024 Smartvalue had debt of JP¥1.35b, up from JP¥873.0m in one year. But it also has JP¥1.64b in cash to offset that, meaning it has JP¥290.0m net cash.
How Healthy Is Smartvalue's Balance Sheet?
We can see from the most recent balance sheet that Smartvalue had liabilities of JP¥1.72b falling due within a year, and liabilities of JP¥925.0m due beyond that. Offsetting this, it had JP¥1.64b in cash and JP¥681.0m in receivables that were due within 12 months. So it has liabilities totalling JP¥323.0m more than its cash and near-term receivables, combined.
Given Smartvalue has a market capitalization of JP¥3.53b, it's hard to believe these liabilities pose much threat. However, we do think it is worth keeping an eye on its balance sheet strength, as it may change over time. Despite its noteworthy liabilities, Smartvalue boasts net cash, so it's fair to say it does not have a heavy debt load! When analysing debt levels, the balance sheet is the obvious place to start. But you can't view debt in total isolation; since Smartvalue will need earnings to service that debt. So if you're keen to discover more about its earnings, it might be worth checking out this graph of its long term earnings trend .
Check out our latest analysis for Smartvalue
Over 12 months, Smartvalue saw its revenue hold pretty steady, and it did not report positive earnings before interest and tax. While that hardly impresses, its not too bad either.
So How Risky Is Smartvalue?
We have no doubt that loss making companies are, in general, riskier than profitable ones. And the fact is that over the last twelve months Smartvalue lost money at the earnings before interest and tax (EBIT) line. And over the same period it saw negative free cash outflow of JP¥856m and booked a JP¥255m accounting loss. But at least it has JP¥290.0m on the balance sheet to spend on growth, near-term. Overall, we'd say the stock is a bit risky, and we're usually very cautious until we see positive free cash flow. The balance sheet is clearly the area to focus on when you are analysing debt. But ultimately, every company can contain risks that exist outside of the balance sheet. These risks can be hard to spot. Every company has them, and we've spotted 2 warning signs for Smartvalue you should know about.
If you're interested in investing in businesses that can grow profits without the burden of debt, then check out this free list of growing businesses that have net cash on the balance sheet.
New: Manage All Your Stock Portfolios in One Place
We've created the ultimate portfolio companion for stock investors, and it's free.
• Connect an unlimited number of Portfolios and see your total in one currency
• Be alerted to new Warning Signs or Risks via email or mobile
• Track the Fair Value of your stocks
Have feedback on this article? Concerned about the content? Get in touch with us directly. Alternatively, email editorial-team (at) simplywallst.com.
This article by Simply Wall St is general in nature. We provide commentary based on historical data and analyst forecasts only using an unbiased methodology and our articles are not intended to be financial advice. It does not constitute a recommendation to buy or sell any stock, and does not take account of your objectives, or your financial situation. We aim to bring you long-term focused analysis driven by fundamental data. Note that our analysis may not factor in the latest price-sensitive company announcements or qualitative material. Simply Wall St has no position in any stocks mentioned.
About TSE:9417
Acceptable track record with mediocre balance sheet.
Market Insights

Advertisement
Community Narratives
MicroVision will explode future revenue by 380.37% with a vision towards success
Fair Value US$60.00|98.4% undervalued
TH
Community Contributor
The Indispensable Artery for a New North American Economy
Fair Value CA$132.87|1.3% undervalued
TI
Community Contributor