
Advertisement
- Japan
- /
- Telecom Services and Carriers
- /
- TSE:9417
Does Smartvalue (TSE:9417) Have A Healthy Balance Sheet?
Some say volatility, rather than debt, is the best way to think about risk as an investor, but Warren Buffett famously said that 'Volatility is far from synonymous with risk.' So it might be obvious that you need to consider debt, when you think about how risky any given stock is, because too much debt can sink a company. We note that Smartvalue Co., Ltd. (TSE:9417) does have debt on its balance sheet. But is this debt a concern to shareholders?
What Risk Does Debt Bring?
Generally speaking, debt only becomes a real problem when a company can't easily pay it off, either by raising capital or with its own cash flow. Part and parcel of capitalism is the process of 'creative destruction' where failed businesses are mercilessly liquidated by their bankers. However, a more usual (but still expensive) situation is where a company must dilute shareholders at a cheap share price simply to get debt under control. Of course, plenty of companies use debt to fund growth, without any negative consequences. When we examine debt levels, we first consider both cash and debt levels, together.
Check out our latest analysis for Smartvalue
What Is Smartvalue's Debt?
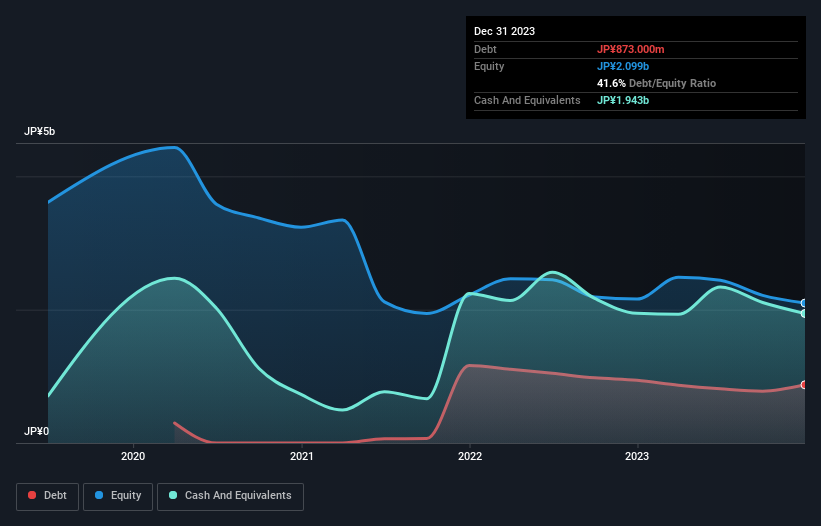
The image below, which you can click on for greater detail, shows that Smartvalue had debt of JP¥873.0m at the end of December 2023, a reduction from JP¥941.0m over a year. However, it does have JP¥1.94b in cash offsetting this, leading to net cash of JP¥1.07b.
A Look At Smartvalue's Liabilities
According to the last reported balance sheet, Smartvalue had liabilities of JP¥1.32b due within 12 months, and liabilities of JP¥268.0m due beyond 12 months. On the other hand, it had cash of JP¥1.94b and JP¥620.0m worth of receivables due within a year. So it can boast JP¥978.0m more liquid assets than total liabilities.
This excess liquidity suggests that Smartvalue is taking a careful approach to debt. Because it has plenty of assets, it is unlikely to have trouble with its lenders. Succinctly put, Smartvalue boasts net cash, so it's fair to say it does not have a heavy debt load! When analysing debt levels, the balance sheet is the obvious place to start. But it is Smartvalue's earnings that will influence how the balance sheet holds up in the future. So when considering debt, it's definitely worth looking at the earnings trend. Click here for an interactive snapshot.
In the last year Smartvalue's revenue was pretty flat, and it made a negative EBIT. While that hardly impresses, its not too bad either.
So How Risky Is Smartvalue?
Statistically speaking companies that lose money are riskier than those that make money. And in the last year Smartvalue had an earnings before interest and tax (EBIT) loss, truth be told. Indeed, in that time it burnt through JP¥82m of cash and made a loss of JP¥213m. While this does make the company a bit risky, it's important to remember it has net cash of JP¥1.07b. That means it could keep spending at its current rate for more than two years. Even though its balance sheet seems sufficiently liquid, debt always makes us a little nervous if a company doesn't produce free cash flow regularly. There's no doubt that we learn most about debt from the balance sheet. However, not all investment risk resides within the balance sheet - far from it. For instance, we've identified 4 warning signs for Smartvalue (2 are concerning) you should be aware of.
When all is said and done, sometimes its easier to focus on companies that don't even need debt. Readers can access a list of growth stocks with zero net debt 100% free, right now.
New: Manage All Your Stock Portfolios in One Place
We've created the ultimate portfolio companion for stock investors, and it's free.
• Connect an unlimited number of Portfolios and see your total in one currency
• Be alerted to new Warning Signs or Risks via email or mobile
• Track the Fair Value of your stocks
Have feedback on this article? Concerned about the content? Get in touch with us directly. Alternatively, email editorial-team (at) simplywallst.com.
This article by Simply Wall St is general in nature. We provide commentary based on historical data and analyst forecasts only using an unbiased methodology and our articles are not intended to be financial advice. It does not constitute a recommendation to buy or sell any stock, and does not take account of your objectives, or your financial situation. We aim to bring you long-term focused analysis driven by fundamental data. Note that our analysis may not factor in the latest price-sensitive company announcements or qualitative material. Simply Wall St has no position in any stocks mentioned.
About TSE:9417
Acceptable track record with mediocre balance sheet.
Market Insights

Advertisement
Community Narratives
MicroVision will explode future revenue by 380.37% with a vision towards success
Fair Value US$60|98.4% undervalued
TH
Community Contributor
The Indispensable Artery for a New North American Economy
Fair Value CA$132.87|1.6% undervalued
TI
Community Contributor
Recently Updated Narratives
BE


Bejgal on MINISO Group Holding ·
MINISO's fair value is projected at 26.69 with an anticipated PE ratio shift of 20x
Fair Value:US$26.6928.0% undervalued
44 followersusers have followed this narrative
3 commentsusers have commented on this narrative
0 likesusers have liked this narrative
TI


TickerTickle on Oracle ·
The Quiet Giant That Became AI’s Power Grid
Fair Value:US$389.8149.5% undervalued
7 followersusers have followed this narrative
1 commentusers have commented on this narrative
0 likesusers have liked this narrative
AU

AuCA on Nova Ljubljanska Banka d.d ·
Nova Ljubljanska Banka d.d will expect a 11.2% revenue boost driving future growth
Fair Value:€20916.3% undervalued
23 followersusers have followed this narrative
3 commentsusers have commented on this narrative
0 likesusers have liked this narrative
Popular Narratives
OS


oscargarcia on Alphabet ·
The company that turned a verb into a global necessity and basically runs the modern internet, digital ads, smartphones, maps, and AI.
Fair Value:US$3404.9% undervalued
134 followersusers have followed this narrative
6 commentsusers have commented on this narrative
18 likesusers have liked this narrative
TH

TheWallstreetKing on MicroVision ·
MicroVision will explode future revenue by 380.37% with a vision towards success
Fair Value:US$6098.4% undervalued
83 followersusers have followed this narrative
11 commentsusers have commented on this narrative
18 likesusers have liked this narrative
AN


AnalystConsensusTarget on NVIDIA ·
NVDA: Expanding AI Demand Will Drive Major Data Center Investments Through 2026
Fair Value:US$232.7923.6% undervalued
921 followersusers have followed this narrative
5 commentsusers have commented on this narrative
21 likesusers have liked this narrative