
Advertisement
- Japan
- /
- Telecom Services and Carriers
- /
- TSE:4415
Even With A 38% Surge, Cautious Investors Are Not Rewarding Broad Enterprise Co.,Ltd.'s (TSE:4415) Performance Completely

The Broad Enterprise Co.,Ltd. (TSE:4415) share price has done very well over the last month, posting an excellent gain of 38%. The last 30 days bring the annual gain to a very sharp 29%.
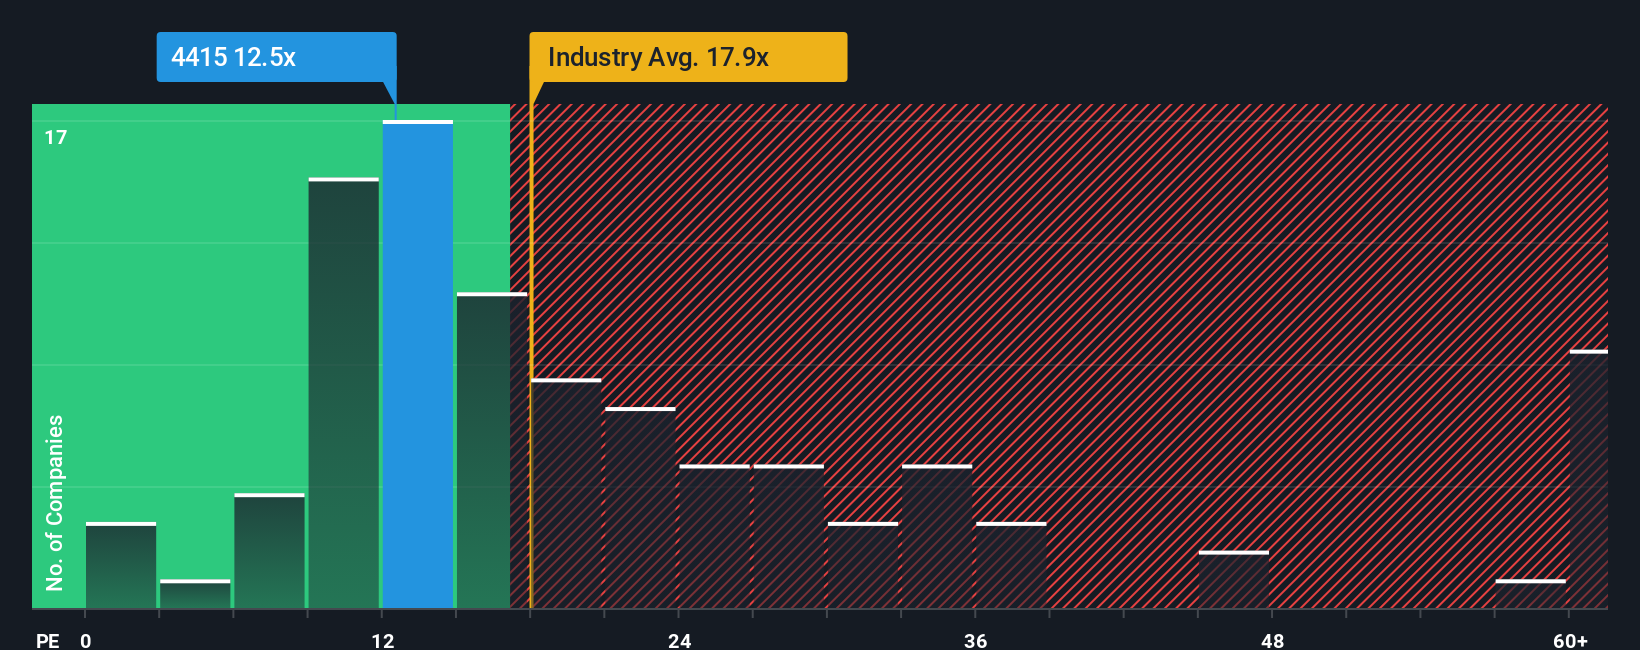
In spite of the firm bounce in price, it's still not a stretch to say that Broad EnterpriseLtd's price-to-earnings (or "P/E") ratio of 12.5x right now seems quite "middle-of-the-road" compared to the market in Japan, where the median P/E ratio is around 14x. Although, it's not wise to simply ignore the P/E without explanation as investors may be disregarding a distinct opportunity or a costly mistake.
With earnings growth that's exceedingly strong of late, Broad EnterpriseLtd has been doing very well. The P/E is probably moderate because investors think this strong earnings growth might not be enough to outperform the broader market in the near future. If you like the company, you'd be hoping this isn't the case so that you could potentially pick up some stock while it's not quite in favour.
Check out our latest analysis for Broad EnterpriseLtd
Does Growth Match The P/E?
In order to justify its P/E ratio, Broad EnterpriseLtd would need to produce growth that's similar to the market.
Retrospectively, the last year delivered an exceptional 82% gain to the company's bottom line. Pleasingly, EPS has also lifted 132% in aggregate from three years ago, thanks to the last 12 months of growth. Therefore, it's fair to say the earnings growth recently has been superb for the company.
This is in contrast to the rest of the market, which is expected to grow by 8.9% over the next year, materially lower than the company's recent medium-term annualised growth rates.
With this information, we find it interesting that Broad EnterpriseLtd is trading at a fairly similar P/E to the market. It may be that most investors are not convinced the company can maintain its recent growth rates.
The Final Word
Broad EnterpriseLtd appears to be back in favour with a solid price jump getting its P/E back in line with most other companies. We'd say the price-to-earnings ratio's power isn't primarily as a valuation instrument but rather to gauge current investor sentiment and future expectations.
Our examination of Broad EnterpriseLtd revealed its three-year earnings trends aren't contributing to its P/E as much as we would have predicted, given they look better than current market expectations. There could be some unobserved threats to earnings preventing the P/E ratio from matching this positive performance. At least the risk of a price drop looks to be subdued if recent medium-term earnings trends continue, but investors seem to think future earnings could see some volatility.
You need to take note of risks, for example - Broad EnterpriseLtd has 3 warning signs (and 1 which is a bit concerning) we think you should know about.
You might be able to find a better investment than Broad EnterpriseLtd. If you want a selection of possible candidates, check out this free list of interesting companies that trade on a low P/E (but have proven they can grow earnings).
Valuation is complex, but we're here to simplify it.
Discover if Broad EnterpriseLtd might be undervalued or overvalued with our detailed analysis, featuring fair value estimates, potential risks, dividends, insider trades, and its financial condition.
Access Free AnalysisHave feedback on this article? Concerned about the content? Get in touch with us directly. Alternatively, email editorial-team (at) simplywallst.com.
This article by Simply Wall St is general in nature. We provide commentary based on historical data and analyst forecasts only using an unbiased methodology and our articles are not intended to be financial advice. It does not constitute a recommendation to buy or sell any stock, and does not take account of your objectives, or your financial situation. We aim to bring you long-term focused analysis driven by fundamental data. Note that our analysis may not factor in the latest price-sensitive company announcements or qualitative material. Simply Wall St has no position in any stocks mentioned.
About TSE:4415
Broad EnterpriseLtd
Provides Internet infrastructure for condominium management in Japan.
Proven track record with mediocre balance sheet.
Market Insights

Advertisement
Community Narratives
MicroVision will explode future revenue by 380.37% with a vision towards success
Fair Value US$60.00|98.4% undervalued
TH
Community Contributor
The Indispensable Artery for a New North American Economy
Fair Value CA$132.87|1.3% undervalued
TI
Community Contributor