
Advertisement
- Japan
- /
- Communications
- /
- TSE:4392
Optimistic Investors Push Future Innovation Group, Inc. (TSE:4392) Shares Up 40% But Growth Is Lacking
Future Innovation Group, Inc. (TSE:4392) shareholders would be excited to see that the share price has had a great month, posting a 40% gain and recovering from prior weakness. Looking further back, the 21% rise over the last twelve months isn't too bad notwithstanding the strength over the last 30 days.
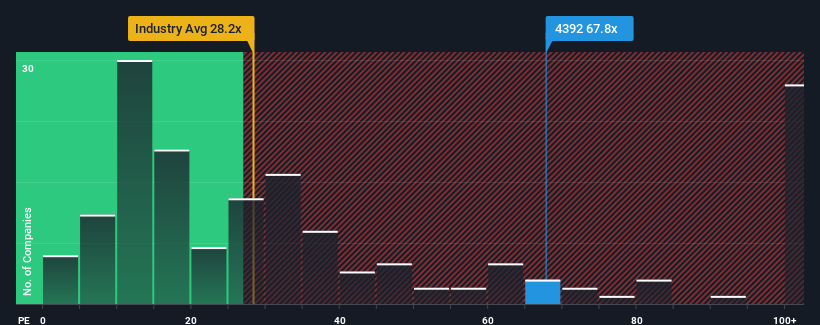
Since its price has surged higher, Future Innovation Group's price-to-earnings (or "P/E") ratio of 67.8x might make it look like a strong sell right now compared to the market in Japan, where around half of the companies have P/E ratios below 13x and even P/E's below 9x are quite common. Although, it's not wise to just take the P/E at face value as there may be an explanation why it's so lofty.
As an illustration, earnings have deteriorated at Future Innovation Group over the last year, which is not ideal at all. It might be that many expect the company to still outplay most other companies over the coming period, which has kept the P/E from collapsing. You'd really hope so, otherwise you're paying a pretty hefty price for no particular reason.
View our latest analysis for Future Innovation Group
Does Growth Match The High P/E?
The only time you'd be truly comfortable seeing a P/E as steep as Future Innovation Group's is when the company's growth is on track to outshine the market decidedly.
If we review the last year of earnings, dishearteningly the company's profits fell to the tune of 73%. This means it has also seen a slide in earnings over the longer-term as EPS is down 74% in total over the last three years. Therefore, it's fair to say the earnings growth recently has been undesirable for the company.
Weighing that medium-term earnings trajectory against the broader market's one-year forecast for expansion of 10% shows it's an unpleasant look.
In light of this, it's alarming that Future Innovation Group's P/E sits above the majority of other companies. Apparently many investors in the company are way more bullish than recent times would indicate and aren't willing to let go of their stock at any price. Only the boldest would assume these prices are sustainable as a continuation of recent earnings trends is likely to weigh heavily on the share price eventually.
What We Can Learn From Future Innovation Group's P/E?
Shares in Future Innovation Group have built up some good momentum lately, which has really inflated its P/E. While the price-to-earnings ratio shouldn't be the defining factor in whether you buy a stock or not, it's quite a capable barometer of earnings expectations.
Our examination of Future Innovation Group revealed its shrinking earnings over the medium-term aren't impacting its high P/E anywhere near as much as we would have predicted, given the market is set to grow. When we see earnings heading backwards and underperforming the market forecasts, we suspect the share price is at risk of declining, sending the high P/E lower. If recent medium-term earnings trends continue, it will place shareholders' investments at significant risk and potential investors in danger of paying an excessive premium.
Before you take the next step, you should know about the 4 warning signs for Future Innovation Group (1 is a bit concerning!) that we have uncovered.
Of course, you might find a fantastic investment by looking at a few good candidates. So take a peek at this free list of companies with a strong growth track record, trading on a low P/E.
New: AI Stock Screener & Alerts
Our new AI Stock Screener scans the market every day to uncover opportunities.
• Dividend Powerhouses (3%+ Yield)
• Undervalued Small Caps with Insider Buying
• High growth Tech and AI Companies
Or build your own from over 50 metrics.
Have feedback on this article? Concerned about the content? Get in touch with us directly. Alternatively, email editorial-team (at) simplywallst.com.
This article by Simply Wall St is general in nature. We provide commentary based on historical data and analyst forecasts only using an unbiased methodology and our articles are not intended to be financial advice. It does not constitute a recommendation to buy or sell any stock, and does not take account of your objectives, or your financial situation. We aim to bring you long-term focused analysis driven by fundamental data. Note that our analysis may not factor in the latest price-sensitive company announcements or qualitative material. Simply Wall St has no position in any stocks mentioned.
About TSE:4392
Future Innovation Group
Through its subsidiaries, engages in the IoT and machine businesses in Japan.
Excellent balance sheet and fair value.
Market Insights

Advertisement
Community Narratives
The company that turned a verb into a global necessity and basically runs the modern internet, digital ads, smartphones, maps, and AI.
Fair Value US$300.00|7.1% undervalued
OS
Community Contributor
Flowers Foods Pays A Fair Price For Health
Fair Value US$16.12|26.4% undervalued
NV
Community Contributor
TMX Group will thrive with 33.3% profit margin and enduring market moat
Fair Value CA$49.90|0.8% overvalued
LI
Community Contributor
The "Molecular Pencil": Why Beam's Technology is Built to Win
Fair Value US$65.01|65.8% undervalued
DA
Community Contributor