
Advertisement
Some say volatility, rather than debt, is the best way to think about risk as an investor, but Warren Buffett famously said that 'Volatility is far from synonymous with risk.' So it might be obvious that you need to consider debt, when you think about how risky any given stock is, because too much debt can sink a company. As with many other companies NSD Co., Ltd. (TSE:9759) makes use of debt. But is this debt a concern to shareholders?
When Is Debt A Problem?
Debt assists a business until the business has trouble paying it off, either with new capital or with free cash flow. If things get really bad, the lenders can take control of the business. However, a more usual (but still expensive) situation is where a company must dilute shareholders at a cheap share price simply to get debt under control. Of course, debt can be an important tool in businesses, particularly capital heavy businesses. The first step when considering a company's debt levels is to consider its cash and debt together.
How Much Debt Does NSD Carry?
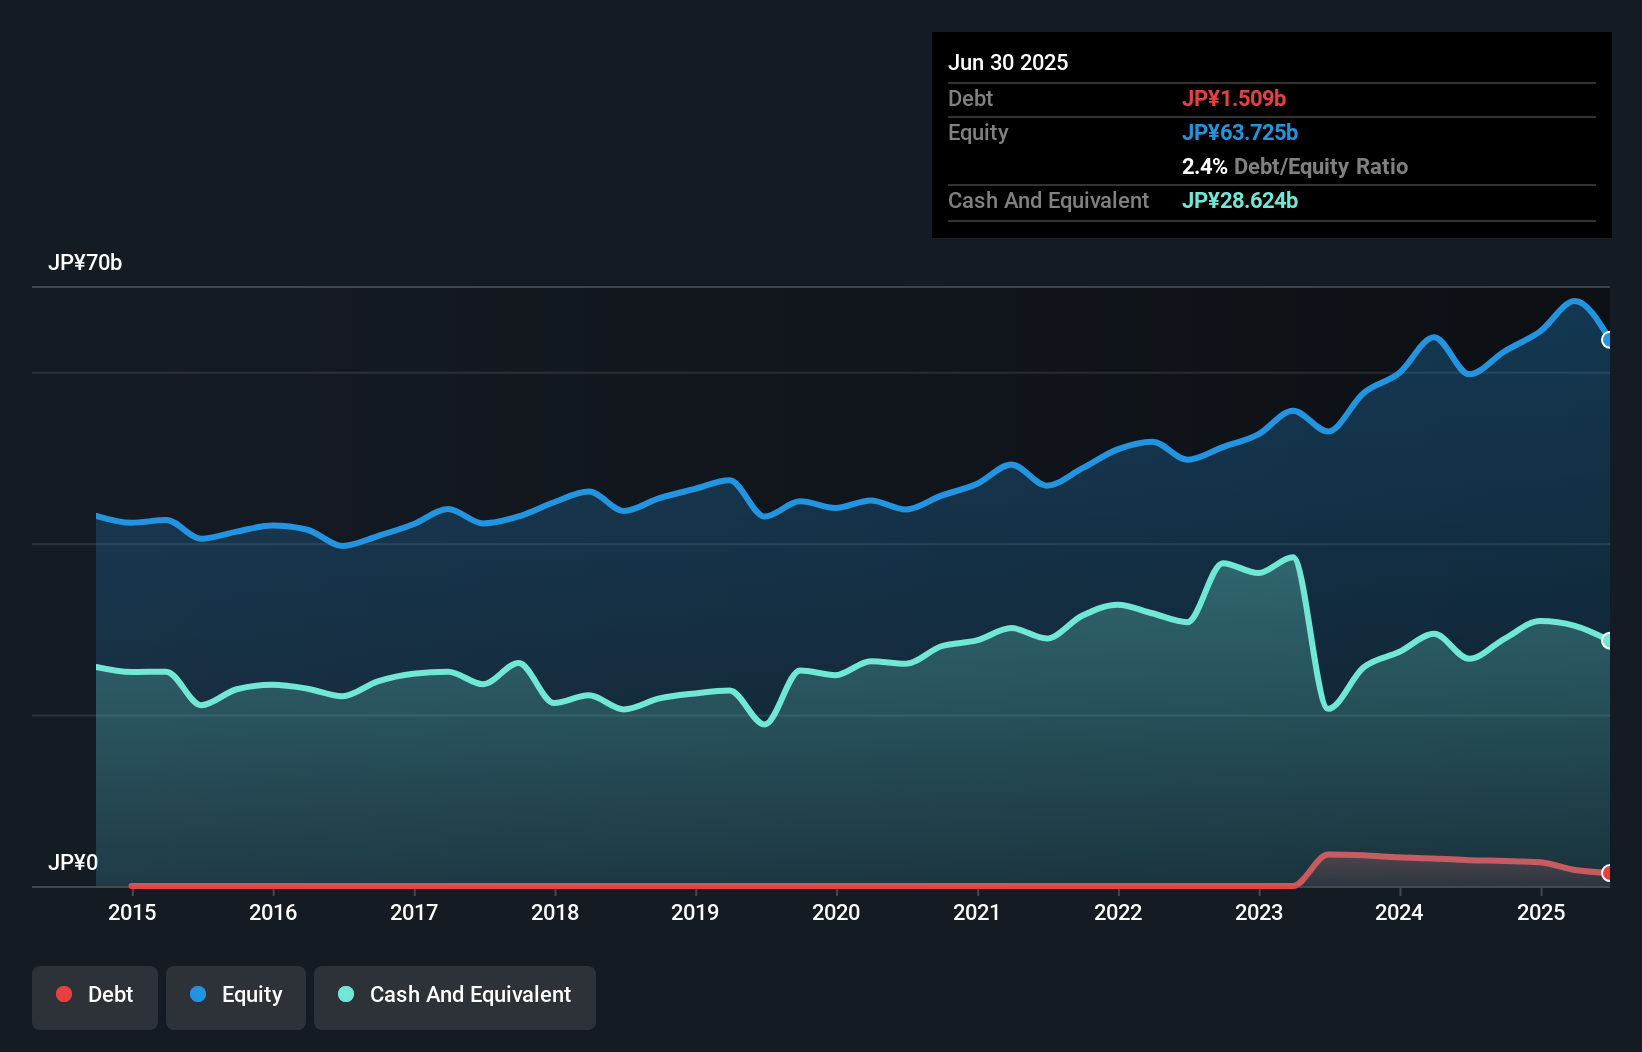
You can click the graphic below for the historical numbers, but it shows that NSD had JP¥1.51b of debt in June 2025, down from JP¥3.02b, one year before. However, it does have JP¥28.6b in cash offsetting this, leading to net cash of JP¥27.1b.
A Look At NSD's Liabilities
Zooming in on the latest balance sheet data, we can see that NSD had liabilities of JP¥12.5b due within 12 months and liabilities of JP¥7.23b due beyond that. On the other hand, it had cash of JP¥28.6b and JP¥17.7b worth of receivables due within a year. So it actually has JP¥26.6b more liquid assets than total liabilities.
This surplus suggests that NSD has a conservative balance sheet, and could probably eliminate its debt without much difficulty. Simply put, the fact that NSD has more cash than debt is arguably a good indication that it can manage its debt safely.
Check out our latest analysis for NSD
And we also note warmly that NSD grew its EBIT by 14% last year, making its debt load easier to handle. When analysing debt levels, the balance sheet is the obvious place to start. But it is future earnings, more than anything, that will determine NSD's ability to maintain a healthy balance sheet going forward. So if you're focused on the future you can check out this free report showing analyst profit forecasts.
But our final consideration is also important, because a company cannot pay debt with paper profits; it needs cold hard cash. NSD may have net cash on the balance sheet, but it is still interesting to look at how well the business converts its earnings before interest and tax (EBIT) to free cash flow, because that will influence both its need for, and its capacity to manage debt. Over the most recent three years, NSD recorded free cash flow worth 73% of its EBIT, which is around normal, given free cash flow excludes interest and tax. This cold hard cash means it can reduce its debt when it wants to.
Summing Up
While we empathize with investors who find debt concerning, you should keep in mind that NSD has net cash of JP¥27.1b, as well as more liquid assets than liabilities. The cherry on top was that in converted 73% of that EBIT to free cash flow, bringing in JP¥11b. So is NSD's debt a risk? It doesn't seem so to us. Over time, share prices tend to follow earnings per share, so if you're interested in NSD, you may well want to click here to check an interactive graph of its earnings per share history.
When all is said and done, sometimes its easier to focus on companies that don't even need debt. Readers can access a list of growth stocks with zero net debt 100% free, right now.
Valuation is complex, but we're here to simplify it.
Discover if NSD might be undervalued or overvalued with our detailed analysis, featuring fair value estimates, potential risks, dividends, insider trades, and its financial condition.
Access Free AnalysisHave feedback on this article? Concerned about the content? Get in touch with us directly. Alternatively, email editorial-team (at) simplywallst.com.
This article by Simply Wall St is general in nature. We provide commentary based on historical data and analyst forecasts only using an unbiased methodology and our articles are not intended to be financial advice. It does not constitute a recommendation to buy or sell any stock, and does not take account of your objectives, or your financial situation. We aim to bring you long-term focused analysis driven by fundamental data. Note that our analysis may not factor in the latest price-sensitive company announcements or qualitative material. Simply Wall St has no position in any stocks mentioned.
About TSE:9759
Excellent balance sheet established dividend payer.
Market Insights

Advertisement
Community Narratives
MicroVision will explode future revenue by 380.37% with a vision towards success
Fair Value US$60.00|98.5% undervalued
TH
Community Contributor
The Indispensable Artery for a New North American Economy
Fair Value CA$132.87|2.3% undervalued
TI
Community Contributor