
Advertisement
It's Down 26% But Goodpatch, Inc. (TSE:7351) Could Be Riskier Than It Looks
Goodpatch, Inc. (TSE:7351) shareholders that were waiting for something to happen have been dealt a blow with a 26% share price drop in the last month. Still, a bad month hasn't completely ruined the past year with the stock gaining 46%, which is great even in a bull market.
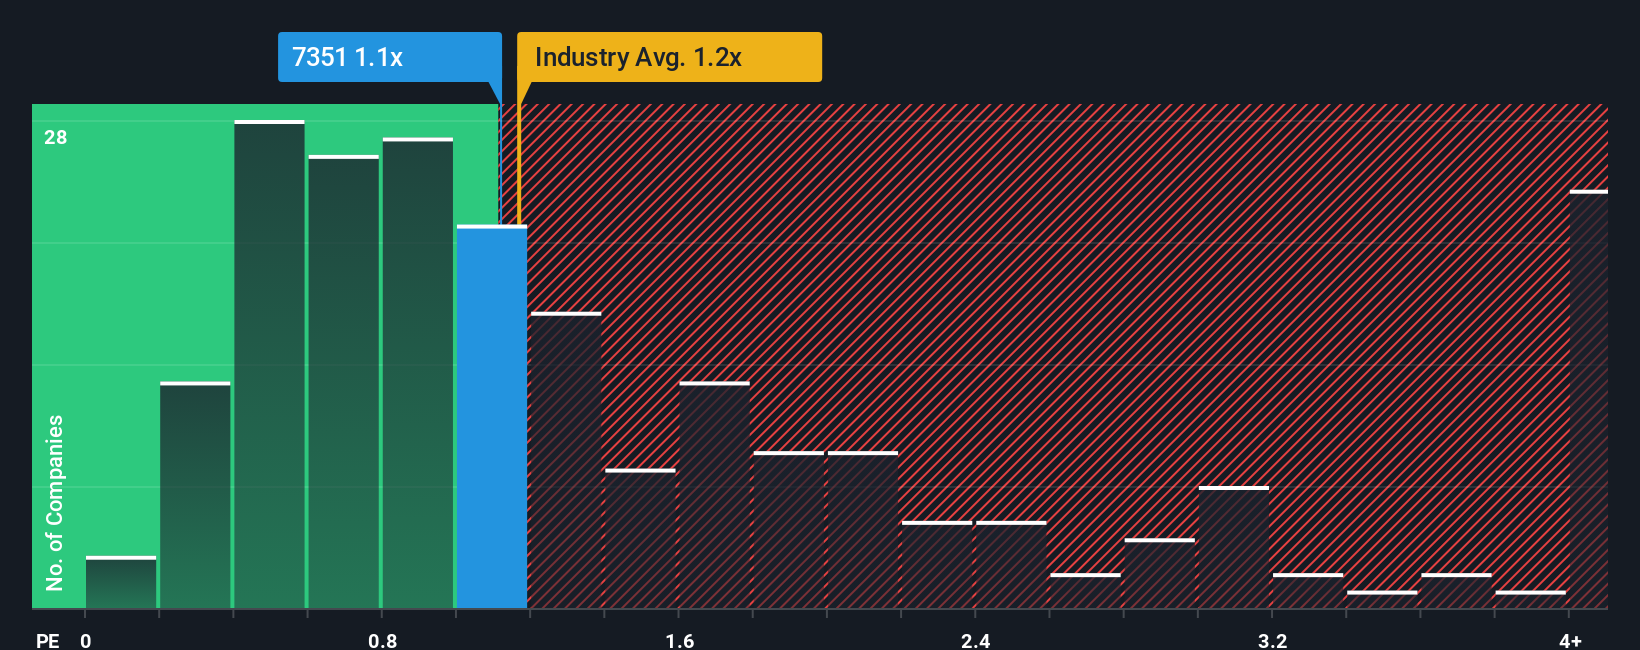
Even after such a large drop in price, there still wouldn't be many who think Goodpatch's price-to-sales (or "P/S") ratio of 1.1x is worth a mention when the median P/S in Japan's IT industry is similar at about 1.2x. Although, it's not wise to simply ignore the P/S without explanation as investors may be disregarding a distinct opportunity or a costly mistake.
Check out our latest analysis for Goodpatch
What Does Goodpatch's Recent Performance Look Like?
Goodpatch has been doing a good job lately as it's been growing revenue at a solid pace. One possibility is that the P/S is moderate because investors think this respectable revenue growth might not be enough to outperform the broader industry in the near future. If that doesn't eventuate, then existing shareholders probably aren't too pessimistic about the future direction of the share price.
We don't have analyst forecasts, but you can see how recent trends are setting up the company for the future by checking out our free report on Goodpatch's earnings, revenue and cash flow.Is There Some Revenue Growth Forecasted For Goodpatch?
There's an inherent assumption that a company should be matching the industry for P/S ratios like Goodpatch's to be considered reasonable.
Retrospectively, the last year delivered an exceptional 29% gain to the company's top line. The strong recent performance means it was also able to grow revenue by 37% in total over the last three years. Therefore, it's fair to say the revenue growth recently has been superb for the company.
This is in contrast to the rest of the industry, which is expected to grow by 6.1% over the next year, materially lower than the company's recent medium-term annualised growth rates.
In light of this, it's curious that Goodpatch's P/S sits in line with the majority of other companies. It may be that most investors are not convinced the company can maintain its recent growth rates.
The Key Takeaway
Goodpatch's plummeting stock price has brought its P/S back to a similar region as the rest of the industry. Typically, we'd caution against reading too much into price-to-sales ratios when settling on investment decisions, though it can reveal plenty about what other market participants think about the company.
We've established that Goodpatch currently trades on a lower than expected P/S since its recent three-year growth is higher than the wider industry forecast. When we see strong revenue with faster-than-industry growth, we can only assume potential risks are what might be placing pressure on the P/S ratio. It appears some are indeed anticipating revenue instability, because the persistence of these recent medium-term conditions would normally provide a boost to the share price.
It is also worth noting that we have found 3 warning signs for Goodpatch (1 can't be ignored!) that you need to take into consideration.
It's important to make sure you look for a great company, not just the first idea you come across. So if growing profitability aligns with your idea of a great company, take a peek at this free list of interesting companies with strong recent earnings growth (and a low P/E).
New: Manage All Your Stock Portfolios in One Place
We've created the ultimate portfolio companion for stock investors, and it's free.
• Connect an unlimited number of Portfolios and see your total in one currency
• Be alerted to new Warning Signs or Risks via email or mobile
• Track the Fair Value of your stocks
Have feedback on this article? Concerned about the content? Get in touch with us directly. Alternatively, email editorial-team (at) simplywallst.com.
This article by Simply Wall St is general in nature. We provide commentary based on historical data and analyst forecasts only using an unbiased methodology and our articles are not intended to be financial advice. It does not constitute a recommendation to buy or sell any stock, and does not take account of your objectives, or your financial situation. We aim to bring you long-term focused analysis driven by fundamental data. Note that our analysis may not factor in the latest price-sensitive company announcements or qualitative material. Simply Wall St has no position in any stocks mentioned.
About TSE:7351
Flawless balance sheet and good value.
Similar Companies
Market Insights

Advertisement
Community Narratives
MicroVision will explode future revenue by 380.37% with a vision towards success
Fair Value US$60.00|98.4% undervalued
TH
Community Contributor
The Indispensable Artery for a New North American Economy
Fair Value CA$132.87|1.3% undervalued
TI
Community Contributor