
Advertisement
Howard Marks put it nicely when he said that, rather than worrying about share price volatility, 'The possibility of permanent loss is the risk I worry about... and every practical investor I know worries about.' So it might be obvious that you need to consider debt, when you think about how risky any given stock is, because too much debt can sink a company. As with many other companies Speee, Inc. (TSE:4499) makes use of debt. But the more important question is: how much risk is that debt creating?
When Is Debt A Problem?
Generally speaking, debt only becomes a real problem when a company can't easily pay it off, either by raising capital or with its own cash flow. In the worst case scenario, a company can go bankrupt if it cannot pay its creditors. However, a more usual (but still expensive) situation is where a company must dilute shareholders at a cheap share price simply to get debt under control. Having said that, the most common situation is where a company manages its debt reasonably well - and to its own advantage. When we examine debt levels, we first consider both cash and debt levels, together.
View our latest analysis for Speee
How Much Debt Does Speee Carry?
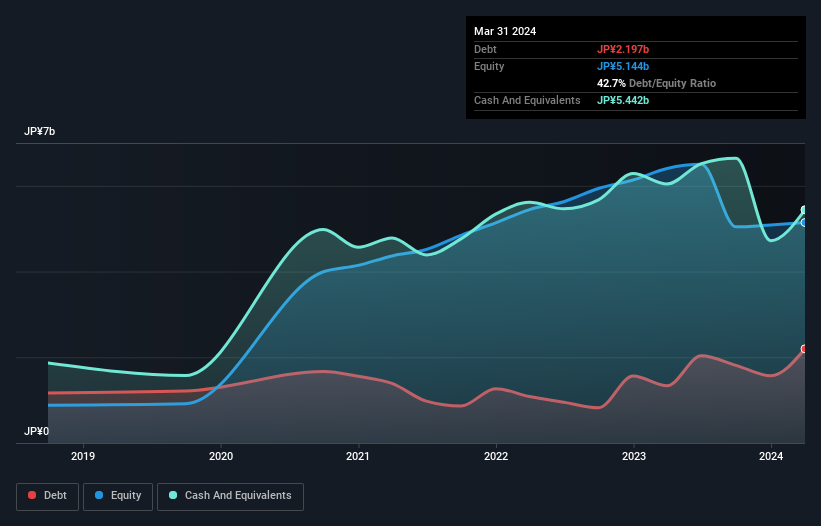
The image below, which you can click on for greater detail, shows that at March 2024 Speee had debt of JP¥2.20b, up from JP¥1.34b in one year. But on the other hand it also has JP¥5.44b in cash, leading to a JP¥3.25b net cash position.
How Strong Is Speee's Balance Sheet?
According to the last reported balance sheet, Speee had liabilities of JP¥3.63b due within 12 months, and liabilities of JP¥1.59b due beyond 12 months. Offsetting this, it had JP¥5.44b in cash and JP¥2.74b in receivables that were due within 12 months. So it can boast JP¥2.96b more liquid assets than total liabilities.
This surplus suggests that Speee has a conservative balance sheet, and could probably eliminate its debt without much difficulty. Simply put, the fact that Speee has more cash than debt is arguably a good indication that it can manage its debt safely.
In fact Speee's saving grace is its low debt levels, because its EBIT has tanked 80% in the last twelve months. When a company sees its earnings tank, it can sometimes find its relationships with its lenders turn sour. There's no doubt that we learn most about debt from the balance sheet. But it is Speee's earnings that will influence how the balance sheet holds up in the future. So if you're keen to discover more about its earnings, it might be worth checking out this graph of its long term earnings trend.
Finally, a business needs free cash flow to pay off debt; accounting profits just don't cut it. Speee may have net cash on the balance sheet, but it is still interesting to look at how well the business converts its earnings before interest and tax (EBIT) to free cash flow, because that will influence both its need for, and its capacity to manage debt. In the last three years, Speee created free cash flow amounting to 7.3% of its EBIT, an uninspiring performance. For us, cash conversion that low sparks a little paranoia about is ability to extinguish debt.
Summing Up
While it is always sensible to investigate a company's debt, in this case Speee has JP¥3.25b in net cash and a decent-looking balance sheet. So we are not troubled with Speee's debt use. The balance sheet is clearly the area to focus on when you are analysing debt. However, not all investment risk resides within the balance sheet - far from it. For instance, we've identified 2 warning signs for Speee that you should be aware of.
Of course, if you're the type of investor who prefers buying stocks without the burden of debt, then don't hesitate to discover our exclusive list of net cash growth stocks, today.
New: Manage All Your Stock Portfolios in One Place
We've created the ultimate portfolio companion for stock investors, and it's free.
• Connect an unlimited number of Portfolios and see your total in one currency
• Be alerted to new Warning Signs or Risks via email or mobile
• Track the Fair Value of your stocks
Have feedback on this article? Concerned about the content? Get in touch with us directly. Alternatively, email editorial-team (at) simplywallst.com.
This article by Simply Wall St is general in nature. We provide commentary based on historical data and analyst forecasts only using an unbiased methodology and our articles are not intended to be financial advice. It does not constitute a recommendation to buy or sell any stock, and does not take account of your objectives, or your financial situation. We aim to bring you long-term focused analysis driven by fundamental data. Note that our analysis may not factor in the latest price-sensitive company announcements or qualitative material. Simply Wall St has no position in any stocks mentioned.
About TSE:4499
Speee
Engages in the marketing intelligence and digital transformation businesses in Japan.
Mediocre balance sheet with very low risk.
Market Insights

Advertisement
Community Narratives
MicroVision will explode future revenue by 380.37% with a vision towards success
Fair Value US$60.00|98.4% undervalued
TH
Community Contributor
The Indispensable Artery for a New North American Economy
Fair Value CA$132.87|1.3% undervalued
TI
Community Contributor