
Advertisement
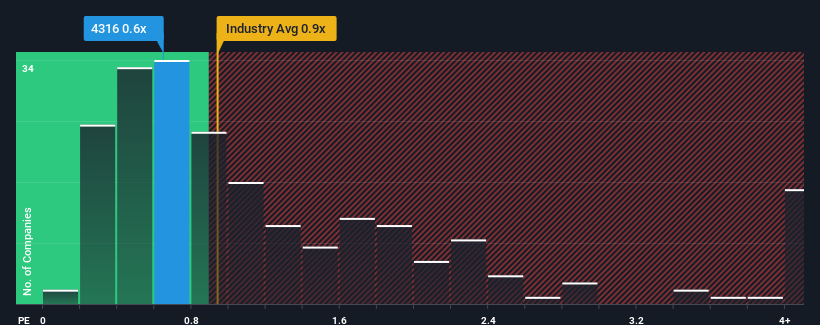
With a median price-to-sales (or "P/S") ratio of close to 0.9x in the IT industry in Japan, you could be forgiven for feeling indifferent about BeMap, Inc.'s (TSE:4316) P/S ratio of 0.6x. However, investors might be overlooking a clear opportunity or potential setback if there is no rational basis for the P/S.
See our latest analysis for BeMap
What Does BeMap's Recent Performance Look Like?
BeMap certainly has been doing a great job lately as it's been growing its revenue at a really rapid pace. It might be that many expect the strong revenue performance to wane, which has kept the share price, and thus the P/S ratio, from rising. Those who are bullish on BeMap will be hoping that this isn't the case, so that they can pick up the stock at a lower valuation.
Want the full picture on earnings, revenue and cash flow for the company? Then our free report on BeMap will help you shine a light on its historical performance.What Are Revenue Growth Metrics Telling Us About The P/S?
In order to justify its P/S ratio, BeMap would need to produce growth that's similar to the industry.
Taking a look back first, we see that the company grew revenue by an impressive 53% last year. As a result, it also grew revenue by 19% in total over the last three years. Accordingly, shareholders would have probably been satisfied with the medium-term rates of revenue growth.
It's interesting to note that the rest of the industry is similarly expected to grow by 5.2% over the next year, which is fairly even with the company's recent medium-term annualised growth rates.
With this information, we can see why BeMap is trading at a fairly similar P/S to the industry. Apparently shareholders are comfortable to simply hold on assuming the company will continue keeping a low profile.
What Does BeMap's P/S Mean For Investors?
Generally, our preference is to limit the use of the price-to-sales ratio to establishing what the market thinks about the overall health of a company.
As we've seen, BeMap's three-year revenue trends seem to be contributing to its P/S, given they look similar to current industry expectations. Right now shareholders are comfortable with the P/S as they are quite confident future revenue won't throw up any surprises. Unless the recent medium-term conditions change, they will continue to support the share price at these levels.
Before you settle on your opinion, we've discovered 2 warning signs for BeMap that you should be aware of.
If you're unsure about the strength of BeMap's business, why not explore our interactive list of stocks with solid business fundamentals for some other companies you may have missed.
Valuation is complex, but we're here to simplify it.
Discover if BeMap might be undervalued or overvalued with our detailed analysis, featuring fair value estimates, potential risks, dividends, insider trades, and its financial condition.
Access Free AnalysisHave feedback on this article? Concerned about the content? Get in touch with us directly. Alternatively, email editorial-team (at) simplywallst.com.
This article by Simply Wall St is general in nature. We provide commentary based on historical data and analyst forecasts only using an unbiased methodology and our articles are not intended to be financial advice. It does not constitute a recommendation to buy or sell any stock, and does not take account of your objectives, or your financial situation. We aim to bring you long-term focused analysis driven by fundamental data. Note that our analysis may not factor in the latest price-sensitive company announcements or qualitative material. Simply Wall St has no position in any stocks mentioned.
Have feedback on this article? Concerned about the content? Get in touch with us directly. Alternatively, email editorial-team@simplywallst.com
About TSE:4316
Flawless balance sheet with low risk.
Market Insights

Advertisement
Community Narratives
The company that turned a verb into a global necessity and basically runs the modern internet, digital ads, smartphones, maps, and AI.
Fair Value US$300.00|6.3% undervalued
OS
Community Contributor
Flowers Foods Pays A Fair Price For Health
Fair Value US$16.12|26.0% undervalued
NV
Community Contributor
TMX Group will thrive with 33.3% profit margin and enduring market moat
Fair Value CA$49.90|3.7% overvalued
LI
Community Contributor