
Advertisement
Appier Group, Inc.'s (TSE:4180) 26% Jump Shows Its Popularity With Investors
The Appier Group, Inc. (TSE:4180) share price has done very well over the last month, posting an excellent gain of 26%. The bad news is that even after the stocks recovery in the last 30 days, shareholders are still underwater by about 4.0% over the last year.
Following the firm bounce in price, when almost half of the companies in Japan's Software industry have price-to-sales ratios (or "P/S") below 2x, you may consider Appier Group as a stock not worth researching with its 5.4x P/S ratio. Nonetheless, we'd need to dig a little deeper to determine if there is a rational basis for the highly elevated P/S.
See our latest analysis for Appier Group
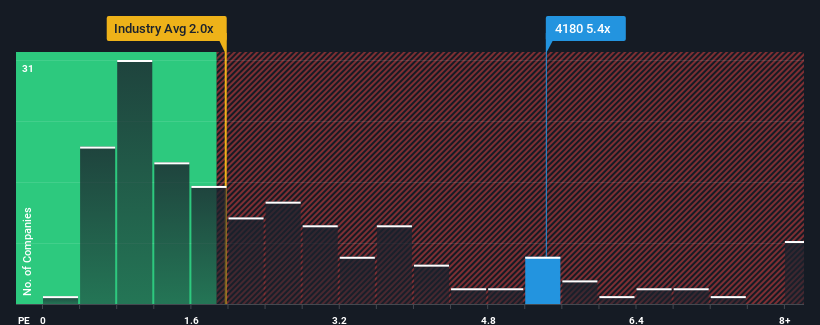
What Does Appier Group's P/S Mean For Shareholders?
Appier Group certainly has been doing a good job lately as it's been growing revenue more than most other companies. It seems that many are expecting the strong revenue performance to persist, which has raised the P/S. You'd really hope so, otherwise you're paying a pretty hefty price for no particular reason.
If you'd like to see what analysts are forecasting going forward, you should check out our free report on Appier Group.Is There Enough Revenue Growth Forecasted For Appier Group?
There's an inherent assumption that a company should far outperform the industry for P/S ratios like Appier Group's to be considered reasonable.
Retrospectively, the last year delivered an exceptional 34% gain to the company's top line. The strong recent performance means it was also able to grow revenue by 188% in total over the last three years. So we can start by confirming that the company has done a great job of growing revenue over that time.
Looking ahead now, revenue is anticipated to climb by 24% each year during the coming three years according to the six analysts following the company. Meanwhile, the rest of the industry is forecast to only expand by 13% per annum, which is noticeably less attractive.
With this in mind, it's not hard to understand why Appier Group's P/S is high relative to its industry peers. Apparently shareholders aren't keen to offload something that is potentially eyeing a more prosperous future.
What Does Appier Group's P/S Mean For Investors?
Shares in Appier Group have seen a strong upwards swing lately, which has really helped boost its P/S figure. It's argued the price-to-sales ratio is an inferior measure of value within certain industries, but it can be a powerful business sentiment indicator.
We've established that Appier Group maintains its high P/S on the strength of its forecasted revenue growth being higher than the the rest of the Software industry, as expected. It appears that shareholders are confident in the company's future revenues, which is propping up the P/S. It's hard to see the share price falling strongly in the near future under these circumstances.
Before you settle on your opinion, we've discovered 2 warning signs for Appier Group (1 makes us a bit uncomfortable!) that you should be aware of.
Of course, profitable companies with a history of great earnings growth are generally safer bets. So you may wish to see this free collection of other companies that have reasonable P/E ratios and have grown earnings strongly.
New: Manage All Your Stock Portfolios in One Place
We've created the ultimate portfolio companion for stock investors, and it's free.
• Connect an unlimited number of Portfolios and see your total in one currency
• Be alerted to new Warning Signs or Risks via email or mobile
• Track the Fair Value of your stocks
Have feedback on this article? Concerned about the content? Get in touch with us directly. Alternatively, email editorial-team (at) simplywallst.com.
This article by Simply Wall St is general in nature. We provide commentary based on historical data and analyst forecasts only using an unbiased methodology and our articles are not intended to be financial advice. It does not constitute a recommendation to buy or sell any stock, and does not take account of your objectives, or your financial situation. We aim to bring you long-term focused analysis driven by fundamental data. Note that our analysis may not factor in the latest price-sensitive company announcements or qualitative material. Simply Wall St has no position in any stocks mentioned.
About TSE:4180
Appier Group
Operates as AI-native SaaS company in Japan and internationally.
Flawless balance sheet with reasonable growth potential.
Similar Companies
Market Insights

Advertisement
Community Narratives
MicroVision will explode future revenue by 380.37% with a vision towards success
Fair Value US$60.00|98.4% undervalued
TH
Community Contributor
The Indispensable Artery for a New North American Economy
Fair Value CA$132.87|1.3% undervalued
TI
Community Contributor