Stock Analysis
- Japan
- /
- Semiconductors
- /
- TSE:4369
Exploring istyle And Two More High-Growth Japanese Stocks With Significant Insider Ownership

Reviewed by Simply Wall St

Amidst a mixed performance in Japan's stock markets, with the Nikkei 225 showing modest gains while the broader TOPIX Index experienced a slight decline, investors continue to seek stable opportunities in growth-oriented companies. High insider ownership is often regarded as a positive indicator of confidence in a company’s future prospects, aligning management’s interests with those of shareholders.
Top 10 Growth Companies With High Insider Ownership In Japan
| Name | Insider Ownership | Earnings Growth |
| SHIFT (TSE:3697) | 35.4% | 26.8% |
| Kanamic NetworkLTD (TSE:3939) | 25% | 28.9% |
| Hottolink (TSE:3680) | 27% | 57.3% |
| Medley (TSE:4480) | 34% | 28.7% |
| Micronics Japan (TSE:6871) | 15.3% | 39.7% |
| Kasumigaseki CapitalLtd (TSE:3498) | 34.8% | 44.6% |
| ExaWizards (TSE:4259) | 24.8% | 91.1% |
| Soiken Holdings (TSE:2385) | 19.8% | 118.4% |
| Soracom (TSE:147A) | 17.2% | 54.1% |
| freee K.K (TSE:4478) | 24% | 80.9% |
Let's explore several standout options from the results in the screener.
istyle (TSE:3660)
Simply Wall St Growth Rating: ★★★★☆☆
Overview: istyle Inc. operates the beauty portal site @cosme, serving both domestic and international markets, with a market capitalization of approximately ¥40.49 billion.
Operations: The company generates revenue primarily through its beauty portal site @cosme, catering to users globally.
Insider Ownership: 18.3%
istyle has demonstrated robust growth, with earnings surging by 1476.8% over the past year. Looking ahead, both revenue and earnings are expected to outpace the Japanese market, with annual increases of 4.8% and 26.8%, respectively. However, challenges such as shareholder dilution and a forecasted low return on equity of 8.8% in three years may temper optimism. No significant insider trading activity has been reported recently, maintaining stability in ownership dynamics.
- Click here and access our complete growth analysis report to understand the dynamics of istyle.
- According our valuation report, there's an indication that istyle's share price might be on the expensive side.
Avant Group (TSE:3836)
Simply Wall St Growth Rating: ★★★★★☆
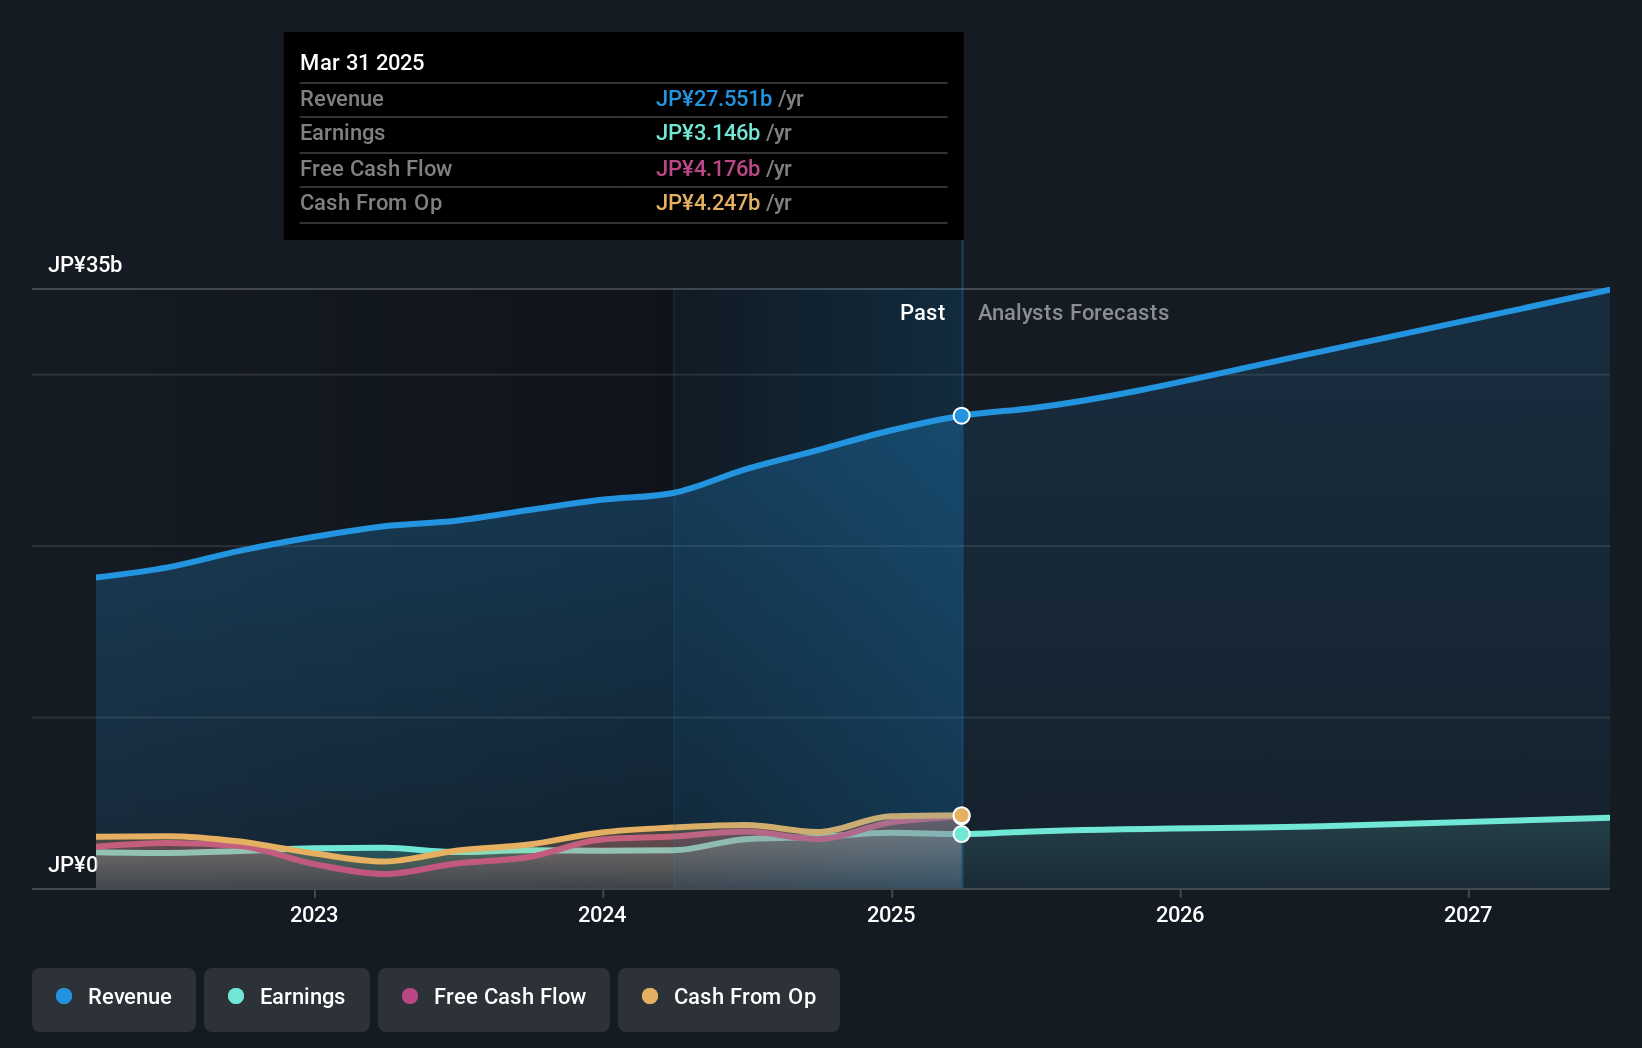
Overview: Avant Group Corporation operates in providing accounting, business intelligence, and outsourcing services through its subsidiaries, with a market capitalization of approximately ¥49.62 billion.
Operations: Avant Group Corporation generates revenue from accounting, business intelligence, and outsourcing services.
Insider Ownership: 35.2%
Avant Group, with its recent share repurchase initiative aimed at enhancing shareholder value, reflects a proactive management approach. The company forecasts a healthy revenue increase to ¥24 billion and an operating profit of ¥3.85 billion for FY 2024. While its revenue growth rate of 15.6% per year is robust compared to the Japanese market average, it's slightly below the high-growth benchmark of 20%. Avant's earnings are expected to grow significantly, outpacing market trends with an anticipated high return on equity in three years.
- Get an in-depth perspective on Avant Group's performance by reading our analyst estimates report here.
- Our comprehensive valuation report raises the possibility that Avant Group is priced lower than what may be justified by its financials.
Tri Chemical Laboratories (TSE:4369)
Simply Wall St Growth Rating: ★★★★★☆
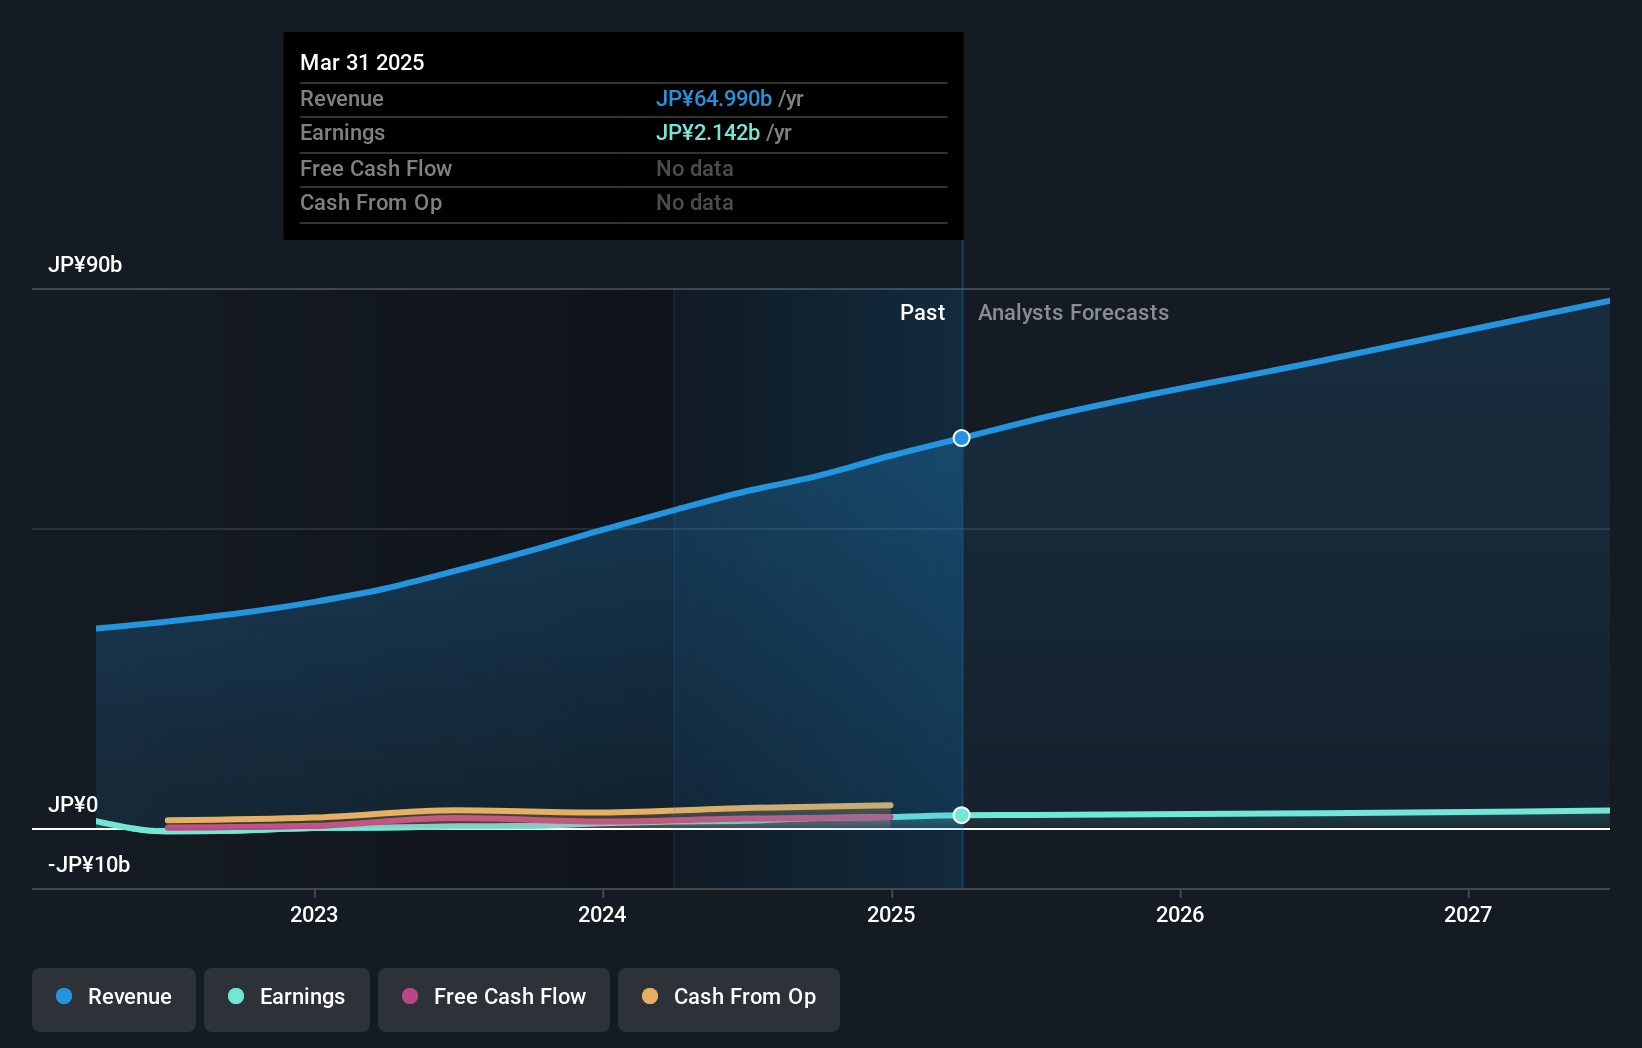
Overview: Tri Chemical Laboratories Inc., operating in Japan, specializes in producing chemical products for industries such as semiconductors, coatings, optical fibers, solar cells, and compound semiconductors with a market cap of ¥129.01 billion.
Operations: The company generates revenue from the production of chemical products used in various sectors including semiconductors, coatings, optical fibers, solar cells, and compound semiconductors.
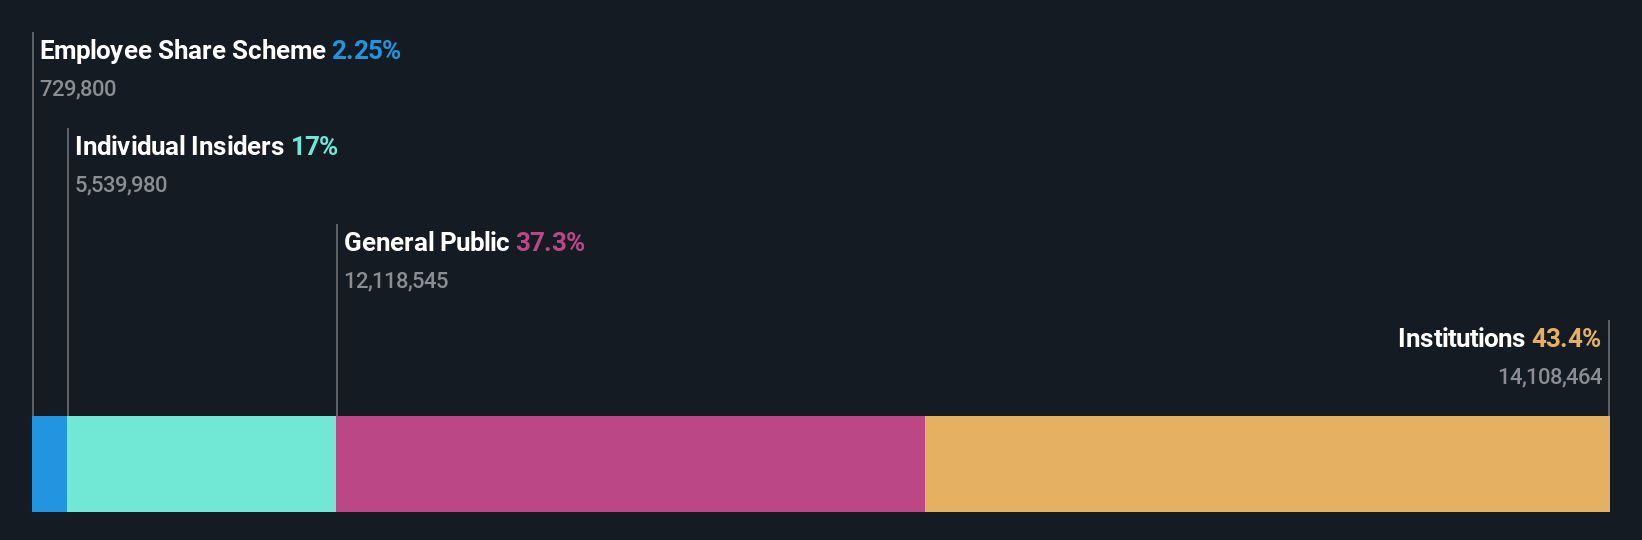
Insider Ownership: 17.4%
Tri Chemical Laboratories, despite a recent dip in profit margins from 32.6% to 20.3%, remains poised for substantial growth with earnings and revenue forecasted to increase by 34.72% and 27.5% per year respectively—well above the Japanese market averages of 8.8% and 4.1%. However, the company's share price has been highly volatile over the past three months, and its return on equity is expected to be relatively low at 16.5% in three years.
- Dive into the specifics of Tri Chemical Laboratories here with our thorough growth forecast report.
- Our comprehensive valuation report raises the possibility that Tri Chemical Laboratories is priced higher than what may be justified by its financials.
Taking Advantage
- Click here to access our complete index of 99 Fast Growing Japanese Companies With High Insider Ownership.
- Shareholder in one or more of these companies? Ensure you're never caught off-guard by adding your portfolio in Simply Wall St for timely alerts on significant stock developments.
- Simply Wall St is a revolutionary app designed for long-term stock investors, it's free and covers every market in the world.
Ready For A Different Approach?
- Explore high-performing small cap companies that haven't yet garnered significant analyst attention.
- Diversify your portfolio with solid dividend payers offering reliable income streams to weather potential market turbulence.
- Find companies with promising cash flow potential yet trading below their fair value.
This article by Simply Wall St is general in nature. We provide commentary based on historical data and analyst forecasts only using an unbiased methodology and our articles are not intended to be financial advice. It does not constitute a recommendation to buy or sell any stock, and does not take account of your objectives, or your financial situation. We aim to bring you long-term focused analysis driven by fundamental data. Note that our analysis may not factor in the latest price-sensitive company announcements or qualitative material. Simply Wall St has no position in any stocks mentioned.The analysis only considers stock directly held by insiders. It does not include indirectly owned stock through other vehicles such as corporate and/or trust entities. All forecast revenue and earnings growth rates quoted are in terms of annualised (per annum) growth rates over 1-3 years.
Valuation is complex, but we're helping make it simple.
Find out whether Tri Chemical Laboratories is potentially over or undervalued by checking out our comprehensive analysis, which includes fair value estimates, risks and warnings, dividends, insider transactions and financial health.
View the Free AnalysisHave feedback on this article? Concerned about the content? Get in touch with us directly. Alternatively, email editorial-team@simplywallst.com
About TSE:4369
Tri Chemical Laboratories
Provides chemical products for semiconductors, coating, optical fibers, solar cells, and compound semiconductors.
Flawless balance sheet with high growth potential.
