- Japan
- /
- Semiconductors
- /
- TSE:7729
Tokyo Seimitsu's (TSE:7729) five-year earnings growth trails the 42% YoY shareholder returns


Long term investing can be life changing when you buy and hold the truly great businesses. While the best companies are hard to find, but they can generate massive returns over long periods. Don't believe it? Then look at the Tokyo Seimitsu Co., Ltd. (TSE:7729) share price. It's 394% higher than it was five years ago. If that doesn't get you thinking about long term investing, we don't know what will. And in the last month, the share price has gained 16%. We note that Tokyo Seimitsu reported its financial results recently; luckily, you can catch up on the latest revenue and profit numbers in our company report.
The past week has proven to be lucrative for Tokyo Seimitsu investors, so let's see if fundamentals drove the company's five-year performance.
Check out our latest analysis for Tokyo Seimitsu
To paraphrase Benjamin Graham: Over the short term the market is a voting machine, but over the long term it's a weighing machine. By comparing earnings per share (EPS) and share price changes over time, we can get a feel for how investor attitudes to a company have morphed over time.
During five years of share price growth, Tokyo Seimitsu achieved compound earnings per share (EPS) growth of 6.3% per year. This EPS growth is slower than the share price growth of 38% per year, over the same period. This suggests that market participants hold the company in higher regard, these days. That's not necessarily surprising considering the five-year track record of earnings growth.
You can see below how EPS has changed over time (discover the exact values by clicking on the image).
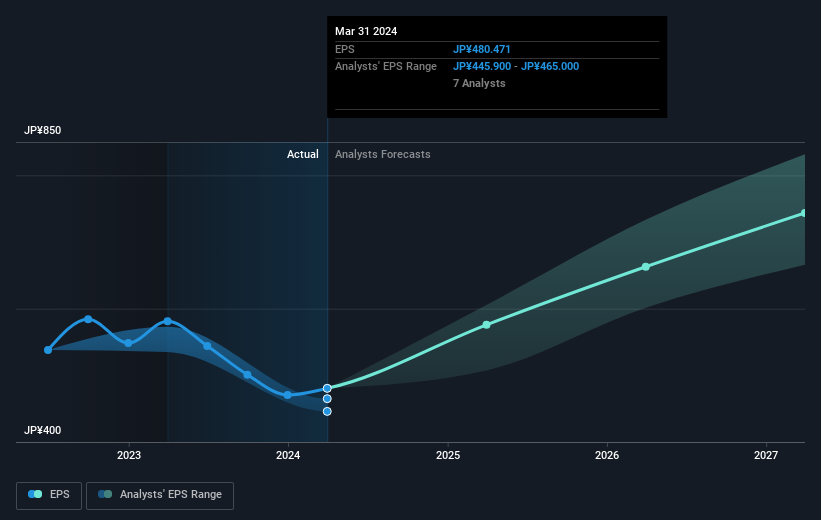
This free interactive report on Tokyo Seimitsu's earnings, revenue and cash flow is a great place to start, if you want to investigate the stock further.
What About Dividends?
As well as measuring the share price return, investors should also consider the total shareholder return (TSR). The TSR incorporates the value of any spin-offs or discounted capital raisings, along with any dividends, based on the assumption that the dividends are reinvested. It's fair to say that the TSR gives a more complete picture for stocks that pay a dividend. We note that for Tokyo Seimitsu the TSR over the last 5 years was 478%, which is better than the share price return mentioned above. And there's no prize for guessing that the dividend payments largely explain the divergence!
A Different Perspective
It's nice to see that Tokyo Seimitsu shareholders have received a total shareholder return of 80% over the last year. And that does include the dividend. That's better than the annualised return of 42% over half a decade, implying that the company is doing better recently. Someone with an optimistic perspective could view the recent improvement in TSR as indicating that the business itself is getting better with time. I find it very interesting to look at share price over the long term as a proxy for business performance. But to truly gain insight, we need to consider other information, too. For instance, we've identified 1 warning sign for Tokyo Seimitsu that you should be aware of.
We will like Tokyo Seimitsu better if we see some big insider buys. While we wait, check out this free list of undervalued stocks (mostly small caps) with considerable, recent, insider buying.
Please note, the market returns quoted in this article reflect the market weighted average returns of stocks that currently trade on Japanese exchanges.
Valuation is complex, but we're here to simplify it.
Discover if Tokyo Seimitsu might be undervalued or overvalued with our detailed analysis, featuring fair value estimates, potential risks, dividends, insider trades, and its financial condition.
Access Free AnalysisHave feedback on this article? Concerned about the content? Get in touch with us directly. Alternatively, email editorial-team (at) simplywallst.com.
This article by Simply Wall St is general in nature. We provide commentary based on historical data and analyst forecasts only using an unbiased methodology and our articles are not intended to be financial advice. It does not constitute a recommendation to buy or sell any stock, and does not take account of your objectives, or your financial situation. We aim to bring you long-term focused analysis driven by fundamental data. Note that our analysis may not factor in the latest price-sensitive company announcements or qualitative material. Simply Wall St has no position in any stocks mentioned.
Have feedback on this article? Concerned about the content? Get in touch with us directly. Alternatively, email editorial-team@simplywallst.com
About TSE:7729
Tokyo Seimitsu
Manufactures and sells semiconductor production equipment (SPE) and measuring instruments in Japan.
Excellent balance sheet and good value.
