- Japan
- /
- Semiconductors
- /
- TSE:4369
3 Japanese Growth Stocks With Insider Ownership Up To 33%

Reviewed by Simply Wall St

Japan's stock markets have recently experienced volatility, with the Nikkei 225 Index and the broader TOPIX Index both registering declines as investors reacted to political changes and monetary policy signals. Despite these fluctuations, opportunities remain for growth-oriented investors, particularly in companies where high insider ownership aligns management interests with shareholders. In this context, identifying growth stocks with significant insider stakes can be a compelling strategy for navigating uncertain market conditions.
Top 10 Growth Companies With High Insider Ownership In Japan
| Name | Insider Ownership | Earnings Growth |
| Micronics Japan (TSE:6871) | 15.3% | 31.5% |
| Hottolink (TSE:3680) | 26.1% | 61.5% |
| Kasumigaseki CapitalLtd (TSE:3498) | 34.7% | 40.2% |
| Medley (TSE:4480) | 34% | 30.4% |
| Inforich (TSE:9338) | 19.1% | 29.8% |
| Kanamic NetworkLTD (TSE:3939) | 25% | 28.3% |
| ExaWizards (TSE:4259) | 22% | 75.2% |
| Money Forward (TSE:3994) | 21.4% | 68.1% |
| Loadstar Capital K.K (TSE:3482) | 33.8% | 24.3% |
| AeroEdge (TSE:7409) | 10.7% | 25.3% |
Here's a peek at a few of the choices from the screener.
Loadstar Capital K.K (TSE:3482)
Simply Wall St Growth Rating: ★★★★★☆
Overview: Loadstar Capital K.K. operates in the real estate investment sector in Japan with a market capitalization of ¥38.77 billion.
Operations: The company generates revenue of ¥29.40 billion from its real estate related business in Japan.
Insider Ownership: 33.8%
Loadstar Capital K.K. is positioned for strong growth, with revenue forecasted to rise 21.9% annually, outpacing the Japanese market's 4.2%. Earnings are expected to grow significantly at 24.3% per year, surpassing market averages of 8.7%. Despite its unstable dividend history and debt concerns relative to operating cash flow, the stock trades at a substantial discount of 65.4% below estimated fair value and offers good relative value compared to peers.
- Dive into the specifics of Loadstar Capital K.K here with our thorough growth forecast report.
- According our valuation report, there's an indication that Loadstar Capital K.K's share price might be on the cheaper side.
Tri Chemical Laboratories (TSE:4369)
Simply Wall St Growth Rating: ★★★★★☆
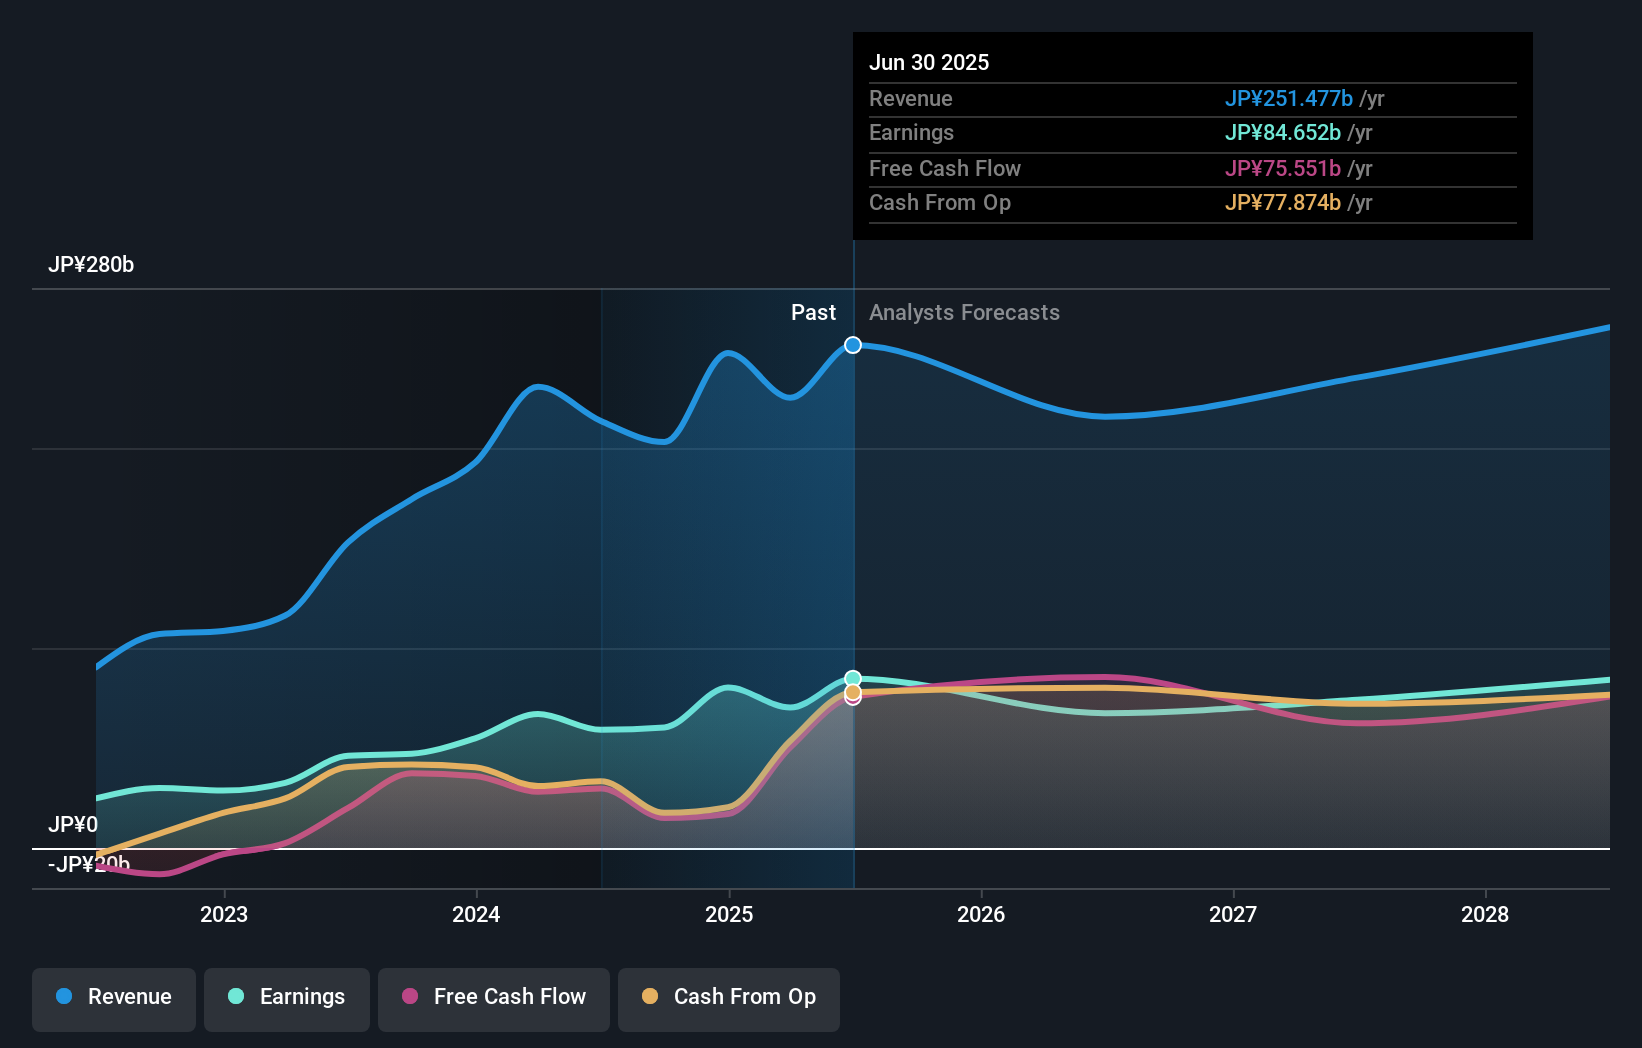
Overview: Tri Chemical Laboratories Inc. supplies chemical products for industries such as semiconductors, coatings, optical fibers, solar cells, and compound semiconductors, with a market cap of ¥110.33 billion.
Operations: The company's revenue is primarily derived from its High-Purity Chemical Compound Business for Manufacturing Semiconductors, which generated ¥13.60 billion.
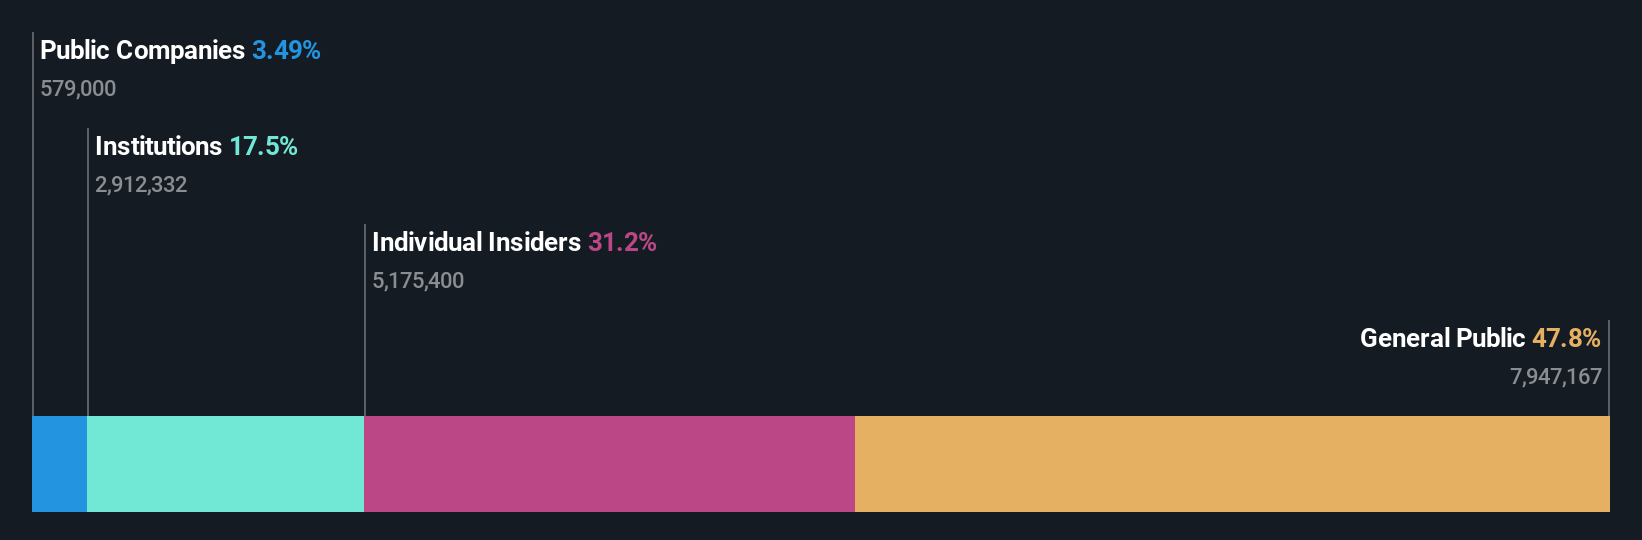
Insider Ownership: 17.4%
Tri Chemical Laboratories is poised for robust growth, with revenue expected to increase by 26.2% annually, significantly outpacing the Japanese market's 4.2%. Earnings are projected to grow at a substantial rate of 35.74% per year, well above the market average of 8.7%, despite a low forecasted return on equity of 19.6%. The stock trades at a notable discount of 59.5% below its estimated fair value, though it has experienced high share price volatility recently.
- Unlock comprehensive insights into our analysis of Tri Chemical Laboratories stock in this growth report.
- Our expertly prepared valuation report Tri Chemical Laboratories implies its share price may be too high.
Lasertec (TSE:6920)
Simply Wall St Growth Rating: ★★★★☆☆
Overview: Lasertec Corporation designs, manufactures, and sells inspection and measurement equipment both in Japan and internationally, with a market cap of ¥2.22 trillion.
Operations: Lasertec's revenue is derived from its activities in designing, manufacturing, and selling inspection and measurement equipment both domestically and globally.
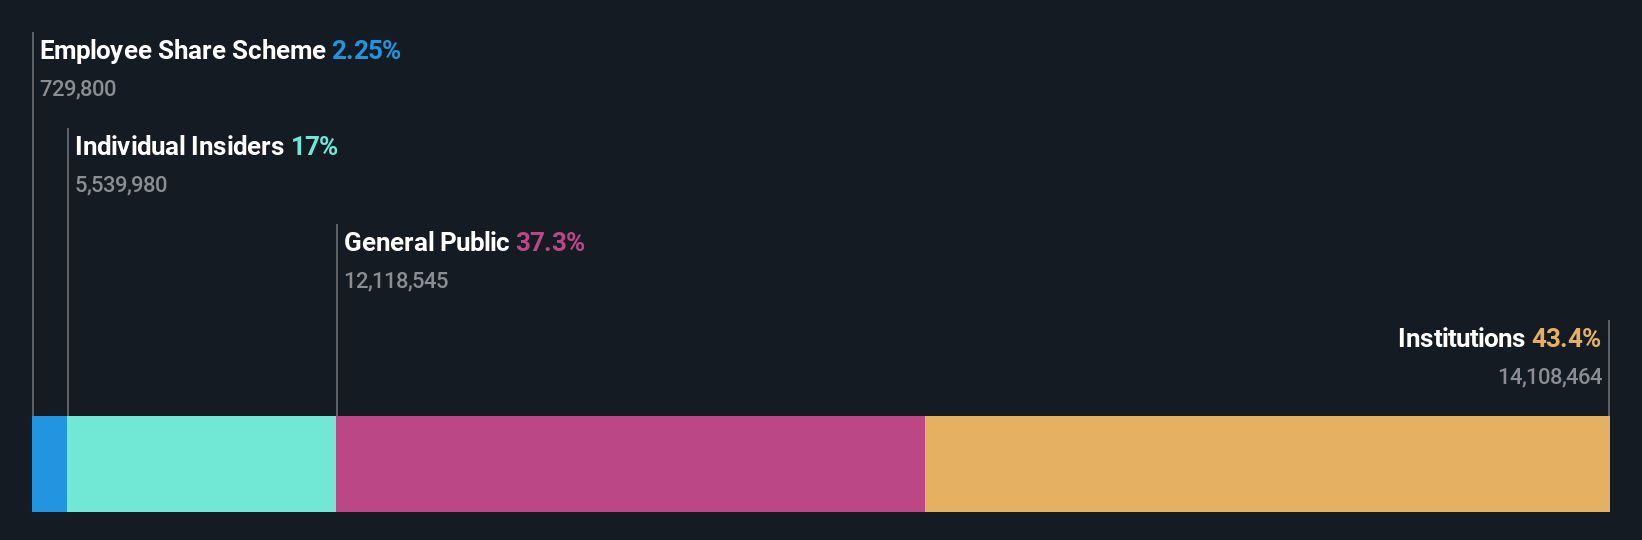
Insider Ownership: 11.1%
Lasertec's earnings are projected to grow at 15.8% annually, surpassing the Japanese market average of 8.7%, while revenue growth is expected at 13.2%, also above the market rate of 4.2%. Despite recent share price volatility, Lasertec maintains high insider ownership and a strong return on equity forecasted at a very high level in three years. Recent board changes and product innovations like the SICA108 highlight its focus on enhancing SiC wafer inspection technology amidst industry challenges.
- Get an in-depth perspective on Lasertec's performance by reading our analyst estimates report here.
- Our valuation report here indicates Lasertec may be overvalued.
Make It Happen
- Click here to access our complete index of 102 Fast Growing Japanese Companies With High Insider Ownership.
- Already own these companies? Link your portfolio to Simply Wall St and get alerts on any new warning signs to your stocks.
- Enhance your investing ability with the Simply Wall St app and enjoy free access to essential market intelligence spanning every continent.
Seeking Other Investments?
- Explore high-performing small cap companies that haven't yet garnered significant analyst attention.
- Diversify your portfolio with solid dividend payers offering reliable income streams to weather potential market turbulence.
- Find companies with promising cash flow potential yet trading below their fair value.
This article by Simply Wall St is general in nature. We provide commentary based on historical data and analyst forecasts only using an unbiased methodology and our articles are not intended to be financial advice. It does not constitute a recommendation to buy or sell any stock, and does not take account of your objectives, or your financial situation. We aim to bring you long-term focused analysis driven by fundamental data. Note that our analysis may not factor in the latest price-sensitive company announcements or qualitative material. Simply Wall St has no position in any stocks mentioned.The analysis only considers stock directly held by insiders. It does not include indirectly owned stock through other vehicles such as corporate and/or trust entities. All forecast revenue and earnings growth rates quoted are in terms of annualised (per annum) growth rates over 1-3 years.
Valuation is complex, but we're here to simplify it.
Discover if Tri Chemical Laboratories might be undervalued or overvalued with our detailed analysis, featuring fair value estimates, potential risks, dividends, insider trades, and its financial condition.
Access Free AnalysisHave feedback on this article? Concerned about the content? Get in touch with us directly. Alternatively, email editorial-team@simplywallst.com
About TSE:4369
Tri Chemical Laboratories
Provides chemical products for semiconductors, coating, optical fibers, solar cells, and compound semiconductors.
Flawless balance sheet with high growth potential.
Market Insights

Community Narratives
