Socionext (TSE:6526) shares have edged up slightly in recent trading, gaining around 2% over the past day. However, the stock remains lower compared to where it traded a month ago. Investors seem to be weighing sector outlook and recent earnings growth to assess its current valuation.
Socionext’s recent dip has grabbed attention, but it comes after a strong multi-year run. While the 1-year total shareholder return is down 9.8%, the longer-term 3-year total return remains an impressive 122%. Short-term momentum has cooled, yet investors continue to weigh the company’s growth prospects and valuation as new catalysts emerge.
With shares still trading at a considerable discount to both analyst targets and estimates of intrinsic value, investors are left to consider whether Socionext's potential is currently underestimated or if the market is already factoring in future growth.
Advertisement
Price-to-Earnings of 41.5x: Is it justified?
Socionext is currently trading at a price-to-earnings ratio (P/E) of 41.5x, significantly higher than both the industry average and what valuation models suggest as fair. At the last close of ¥2,384.5 per share, the stock appears expensive compared to sector norms.
The price-to-earnings ratio shows how much investors are willing to pay today for a yen of Socionext's earnings. This ratio is especially important in the semiconductor industry, where market confidence in future profit growth can quickly drive multiples higher. Such a high P/E typically signals optimism about upcoming profitability, but also raises the bar for future results.
Breaking it down, Socionext's current P/E is more than double the peer average (19.7x) and stands well above the estimated fair level of 35.3x. That leaves the present share price well ahead of both peers and modeled fairness, implying that the market is pricing in ambitious earnings improvements ahead. If those assumptions do not materialize, there is potential for a significant re-rating closer to fair value levels.
However, weaker-than-expected profit growth or sector-wide volatility could challenge the bullish outlook and prompt a reassessment of Socionext's elevated valuation.
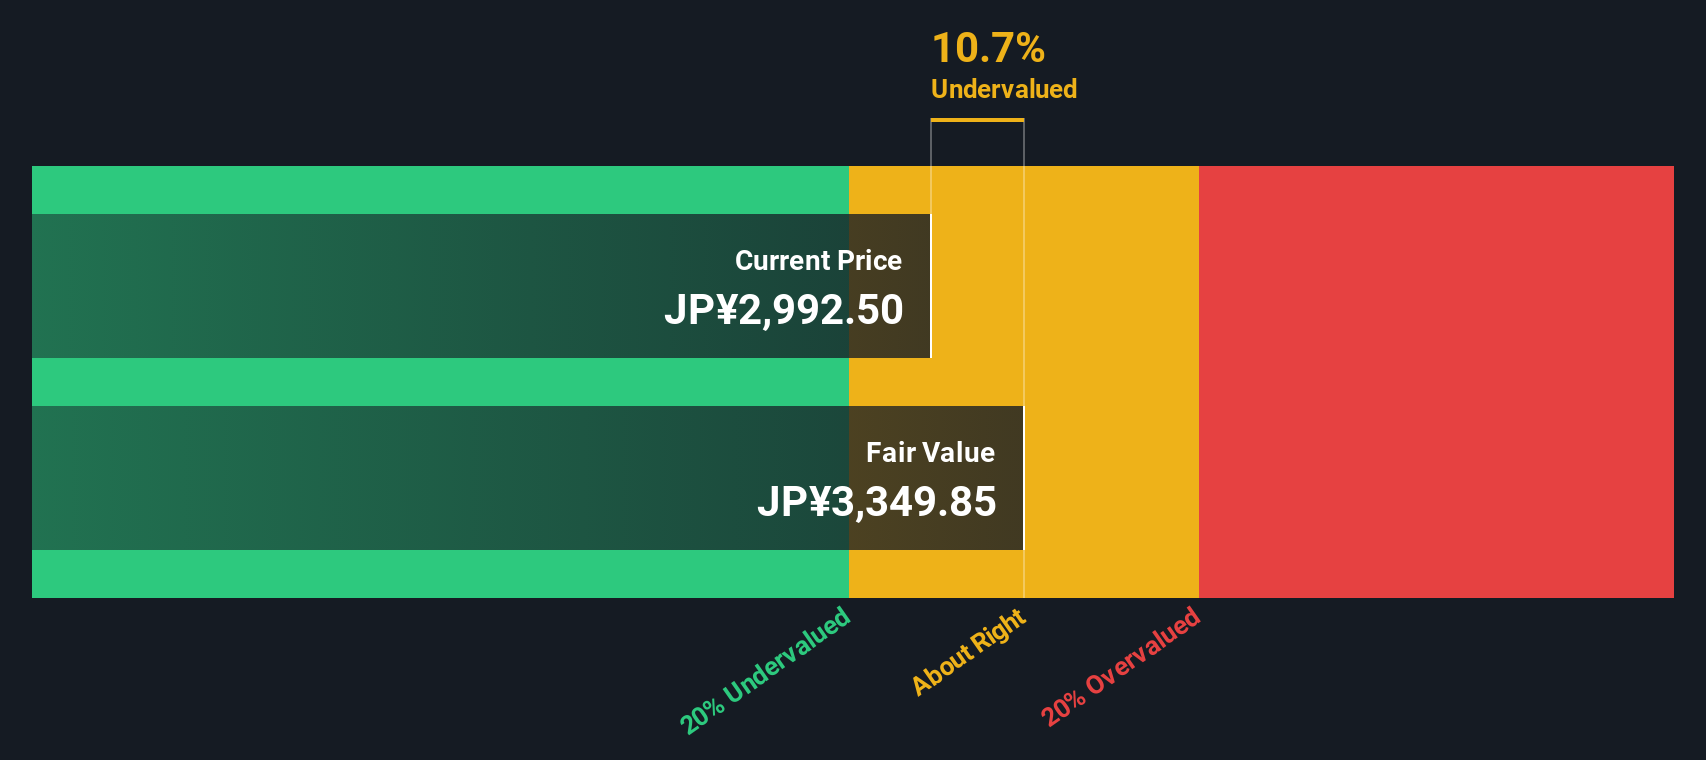
Another View: The SWS DCF Model Points to Undervaluation
While Socionext’s price-to-earnings ratio looks stretched, the SWS DCF model offers a very different signal. Our DCF analysis suggests shares are trading nearly 26% below their estimated fair value. This sharp valuation gap raises the question of whether the market is being too cautious or if there is risk yet to be revealed.
Simply Wall St performs a discounted cash flow (DCF) on every stock in the world every day (check out Socionext for example). We show the entire calculation in full. You can track the result in your watchlist or portfolio and be alerted when this changes, or use our stock screener to discover 861 undervalued stocks based on their cash flows. If you save a screener we even alert you when new companies match - so you never miss a potential opportunity.
Build Your Own Socionext Narrative
If you’d rather investigate the numbers and draw your own conclusions, shaping your personal thesis takes just a few minutes. Do it your way.
Looking for More Compelling Investment Opportunities?
Seize your chance to uncover high-potential stocks before the crowd. Simply Wall Street’s Screeners help you spot standout opportunities that match your strategy.
This article by Simply Wall St is general in nature. We provide commentary based on historical data
and analyst forecasts only using an unbiased methodology and our articles are not intended to be financial advice. It does not constitute a recommendation to buy or sell any stock, and does not take account of your objectives, or your
financial situation. We aim to bring you long-term focused analysis driven by fundamental data.
Note that our analysis may not factor in the latest price-sensitive company announcements or qualitative material.
Simply Wall St has no position in any stocks mentioned.
New: Manage All Your Stock Portfolios in One Place
We've created the ultimate portfolio companion for stock investors, and it's free.
• Connect an unlimited number of Portfolios and see your total in one currency • Be alerted to new Warning Signs or Risks via email or mobile • Track the Fair Value of your stocks