Stock Analysis
- Japan
- /
- Semiconductors
- /
- TSE:6298
Y.A.C. Holdings' (TSE:6298) five-year earnings growth trails the incredible shareholder returns

When you buy a stock there is always a possibility that it could drop 100%. But on the bright side, if you buy shares in a high quality company at the right price, you can gain well over 100%. For example, the Y.A.C. Holdings Co., Ltd. (TSE:6298) share price has soared 255% in the last half decade. Most would be very happy with that. On top of that, the share price is up 20% in about a quarter. But this could be related to the strong market, which is up 19% in the last three months.
On the back of a solid 7-day performance, let's check what role the company's fundamentals have played in driving long term shareholder returns.
Check out our latest analysis for Y.A.C. Holdings
There is no denying that markets are sometimes efficient, but prices do not always reflect underlying business performance. By comparing earnings per share (EPS) and share price changes over time, we can get a feel for how investor attitudes to a company have morphed over time.
During five years of share price growth, Y.A.C. Holdings achieved compound earnings per share (EPS) growth of 9.5% per year. This EPS growth is slower than the share price growth of 29% per year, over the same period. So it's fair to assume the market has a higher opinion of the business than it did five years ago. That's not necessarily surprising considering the five-year track record of earnings growth.
You can see how EPS has changed over time in the image below (click on the chart to see the exact values).
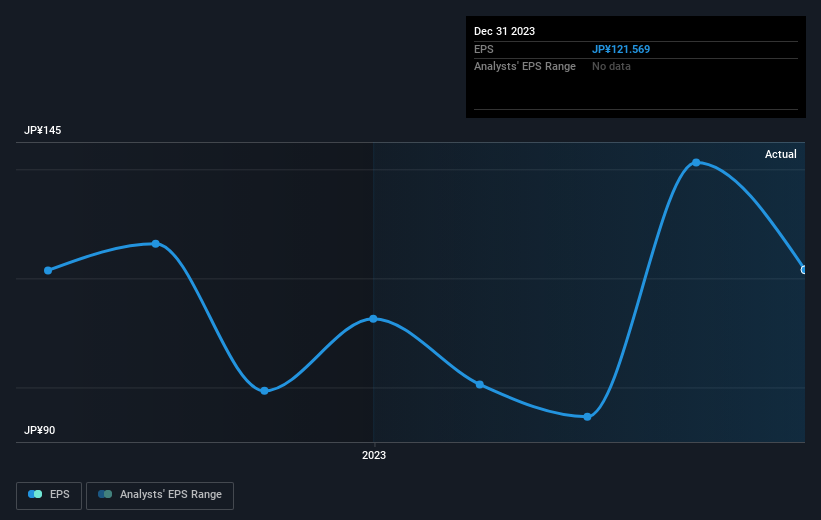
Dive deeper into Y.A.C. Holdings' key metrics by checking this interactive graph of Y.A.C. Holdings's earnings, revenue and cash flow.
What About Dividends?
It is important to consider the total shareholder return, as well as the share price return, for any given stock. The TSR is a return calculation that accounts for the value of cash dividends (assuming that any dividend received was reinvested) and the calculated value of any discounted capital raisings and spin-offs. It's fair to say that the TSR gives a more complete picture for stocks that pay a dividend. We note that for Y.A.C. Holdings the TSR over the last 5 years was 310%, which is better than the share price return mentioned above. The dividends paid by the company have thusly boosted the total shareholder return.
A Different Perspective
Y.A.C. Holdings shareholders are down 5.6% for the year (even including dividends), but the market itself is up 43%. However, keep in mind that even the best stocks will sometimes underperform the market over a twelve month period. On the bright side, long term shareholders have made money, with a gain of 33% per year over half a decade. If the fundamental data continues to indicate long term sustainable growth, the current sell-off could be an opportunity worth considering. It's always interesting to track share price performance over the longer term. But to understand Y.A.C. Holdings better, we need to consider many other factors. Like risks, for instance. Every company has them, and we've spotted 2 warning signs for Y.A.C. Holdings (of which 1 can't be ignored!) you should know about.
If you like to buy stocks alongside management, then you might just love this free list of companies. (Hint: insiders have been buying them).
Please note, the market returns quoted in this article reflect the market weighted average returns of stocks that currently trade on Japanese exchanges.
Valuation is complex, but we're helping make it simple.
Find out whether Y.A.C. Holdings is potentially over or undervalued by checking out our comprehensive analysis, which includes fair value estimates, risks and warnings, dividends, insider transactions and financial health.
View the Free AnalysisHave feedback on this article? Concerned about the content? Get in touch with us directly. Alternatively, email editorial-team (at) simplywallst.com.
This article by Simply Wall St is general in nature. We provide commentary based on historical data and analyst forecasts only using an unbiased methodology and our articles are not intended to be financial advice. It does not constitute a recommendation to buy or sell any stock, and does not take account of your objectives, or your financial situation. We aim to bring you long-term focused analysis driven by fundamental data. Note that our analysis may not factor in the latest price-sensitive company announcements or qualitative material. Simply Wall St has no position in any stocks mentioned.
About TSE:6298
Y.A.C. Holdings
Y.A.C. Holdings Co., Ltd. provides mechatronics, display, industrial machinery, and electronics related products in Japan and internationally.
Proven track record average dividend payer.

