Stock Analysis
- Japan
- /
- Medical Equipment
- /
- TSE:4543
Is Terumo Corporation's (TSE:4543) Stock Price Struggling As A Result Of Its Mixed Financials?


With its stock down 7.3% over the past month, it is easy to disregard Terumo (TSE:4543). It is possible that the markets have ignored the company's differing financials and decided to lean-in to the negative sentiment. Stock prices are usually driven by a company’s financial performance over the long term, and therefore we decided to pay more attention to the company's financial performance. Specifically, we decided to study Terumo's ROE in this article.
Return on Equity or ROE is a test of how effectively a company is growing its value and managing investors’ money. Simply put, it is used to assess the profitability of a company in relation to its equity capital.
Check out our latest analysis for Terumo
How To Calculate Return On Equity?
ROE can be calculated by using the formula:
Return on Equity = Net Profit (from continuing operations) ÷ Shareholders' Equity
So, based on the above formula, the ROE for Terumo is:
8.1% = JP¥99b ÷ JP¥1.2t (Based on the trailing twelve months to December 2023).
The 'return' is the profit over the last twelve months. One way to conceptualize this is that for each ¥1 of shareholders' capital it has, the company made ¥0.08 in profit.
What Has ROE Got To Do With Earnings Growth?
So far, we've learned that ROE is a measure of a company's profitability. We now need to evaluate how much profit the company reinvests or "retains" for future growth which then gives us an idea about the growth potential of the company. Assuming all else is equal, companies that have both a higher return on equity and higher profit retention are usually the ones that have a higher growth rate when compared to companies that don't have the same features.
Terumo's Earnings Growth And 8.1% ROE
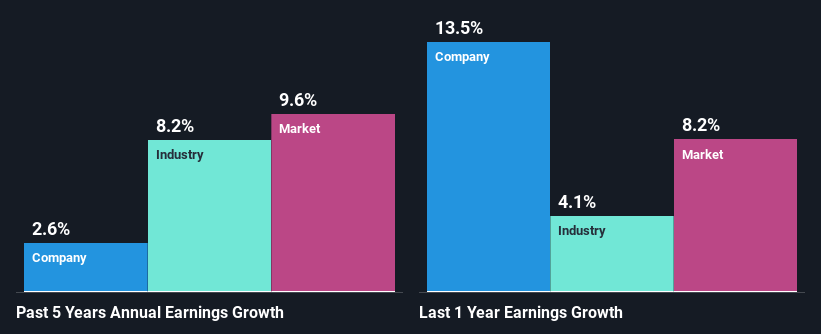
At first glance, Terumo's ROE doesn't look very promising. However, its ROE is similar to the industry average of 8.9%, so we won't completely dismiss the company. We can see that Terumo has grown at a five year net income growth average rate of 2.6%, which is a bit on the lower side. Bear in mind, the company's ROE is not very high . Hence, this does provide some context to low earnings growth seen by the company.
Next, on comparing with the industry net income growth, we found that Terumo's reported growth was lower than the industry growth of 8.2% over the last few years, which is not something we like to see.
Earnings growth is a huge factor in stock valuation. What investors need to determine next is if the expected earnings growth, or the lack of it, is already built into the share price. By doing so, they will have an idea if the stock is headed into clear blue waters or if swampy waters await. What is 4543 worth today? The intrinsic value infographic in our free research report helps visualize whether 4543 is currently mispriced by the market.
Is Terumo Using Its Retained Earnings Effectively?
Despite having a normal three-year median payout ratio of 31% (or a retention ratio of 69% over the past three years, Terumo has seen very little growth in earnings as we saw above. So there might be other factors at play here which could potentially be hampering growth. For example, the business has faced some headwinds.
Moreover, Terumo has been paying dividends for at least ten years or more suggesting that management must have perceived that the shareholders prefer dividends over earnings growth.
Summary
On the whole, we feel that the performance shown by Terumo can be open to many interpretations. While the company does have a high rate of reinvestment, the low ROE means that all that reinvestment is not reaping any benefit to its investors, and moreover, its having a negative impact on the earnings growth. That being so, the latest analyst forecasts show that the company will continue to see an expansion in its earnings. To know more about the latest analysts predictions for the company, check out this visualization of analyst forecasts for the company.
Valuation is complex, but we're helping make it simple.
Find out whether Terumo is potentially over or undervalued by checking out our comprehensive analysis, which includes fair value estimates, risks and warnings, dividends, insider transactions and financial health.
View the Free AnalysisHave feedback on this article? Concerned about the content? Get in touch with us directly. Alternatively, email editorial-team (at) simplywallst.com.
This article by Simply Wall St is general in nature. We provide commentary based on historical data and analyst forecasts only using an unbiased methodology and our articles are not intended to be financial advice. It does not constitute a recommendation to buy or sell any stock, and does not take account of your objectives, or your financial situation. We aim to bring you long-term focused analysis driven by fundamental data. Note that our analysis may not factor in the latest price-sensitive company announcements or qualitative material. Simply Wall St has no position in any stocks mentioned.
About TSE:4543
Terumo
Terumo Corporation engages in the manufacture and sale of medical products and equipment in Japan, Europe, China, the United States, Asia, and internationally.
Flawless balance sheet with solid track record.
