
Advertisement
Howard Marks put it nicely when he said that, rather than worrying about share price volatility, 'The possibility of permanent loss is the risk I worry about... and every practical investor I know worries about.' So it seems the smart money knows that debt - which is usually involved in bankruptcies - is a very important factor, when you assess how risky a company is. Importantly, Nitori Holdings Co., Ltd. (TSE:9843) does carry debt. But the real question is whether this debt is making the company risky.
When Is Debt Dangerous?
Debt assists a business until the business has trouble paying it off, either with new capital or with free cash flow. Ultimately, if the company can't fulfill its legal obligations to repay debt, shareholders could walk away with nothing. However, a more usual (but still expensive) situation is where a company must dilute shareholders at a cheap share price simply to get debt under control. Of course, plenty of companies use debt to fund growth, without any negative consequences. The first step when considering a company's debt levels is to consider its cash and debt together.
How Much Debt Does Nitori Holdings Carry?
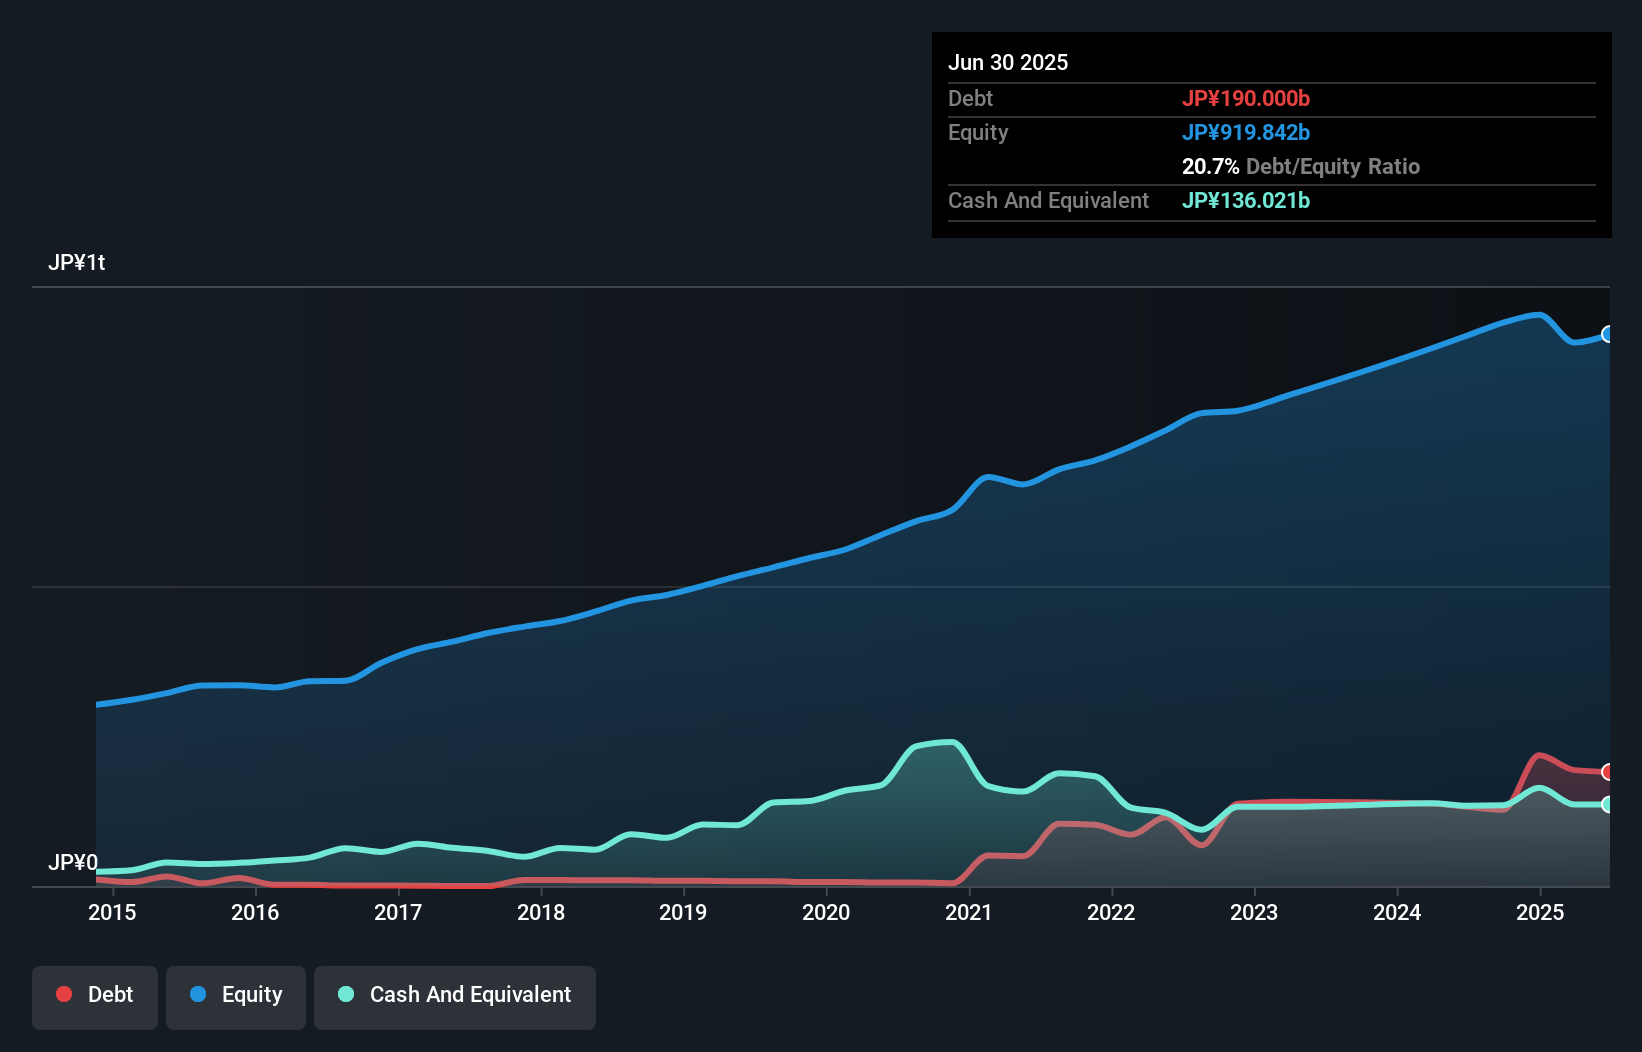
The image below, which you can click on for greater detail, shows that at June 2025 Nitori Holdings had debt of JP¥190.0b, up from JP¥131.9b in one year. However, because it has a cash reserve of JP¥136.0b, its net debt is less, at about JP¥54.0b.
How Healthy Is Nitori Holdings' Balance Sheet?
According to the last reported balance sheet, Nitori Holdings had liabilities of JP¥321.7b due within 12 months, and liabilities of JP¥270.1b due beyond 12 months. Offsetting this, it had JP¥136.0b in cash and JP¥62.9b in receivables that were due within 12 months. So it has liabilities totalling JP¥392.9b more than its cash and near-term receivables, combined.
Nitori Holdings has a market capitalization of JP¥1.41t, so it could very likely raise cash to ameliorate its balance sheet, if the need arose. But we definitely want to keep our eyes open to indications that its debt is bringing too much risk.
Check out our latest analysis for Nitori Holdings
In order to size up a company's debt relative to its earnings, we calculate its net debt divided by its earnings before interest, tax, depreciation, and amortization (EBITDA) and its earnings before interest and tax (EBIT) divided by its interest expense (its interest cover). This way, we consider both the absolute quantum of the debt, as well as the interest rates paid on it.
Nitori Holdings has a low net debt to EBITDA ratio of only 0.27. And its EBIT covers its interest expense a whopping 88.4 times over. So we're pretty relaxed about its super-conservative use of debt. While Nitori Holdings doesn't seem to have gained much on the EBIT line, at least earnings remain stable for now. The balance sheet is clearly the area to focus on when you are analysing debt. But it is future earnings, more than anything, that will determine Nitori Holdings's ability to maintain a healthy balance sheet going forward. So if you want to see what the professionals think, you might find this free report on analyst profit forecasts to be interesting.
But our final consideration is also important, because a company cannot pay debt with paper profits; it needs cold hard cash. So we always check how much of that EBIT is translated into free cash flow. Over the last three years, Nitori Holdings reported free cash flow worth 5.6% of its EBIT, which is really quite low. For us, cash conversion that low sparks a little paranoia about is ability to extinguish debt.
Our View
Nitori Holdings's interest cover was a real positive on this analysis, as was its net debt to EBITDA. In contrast, our confidence was undermined by its apparent struggle to convert EBIT to free cash flow. Looking at all this data makes us feel a little cautious about Nitori Holdings's debt levels. While debt does have its upside in higher potential returns, we think shareholders should definitely consider how debt levels might make the stock more risky. Above most other metrics, we think its important to track how fast earnings per share is growing, if at all. If you've also come to that realization, you're in luck, because today you can view this interactive graph of Nitori Holdings's earnings per share history for free.
Of course, if you're the type of investor who prefers buying stocks without the burden of debt, then don't hesitate to discover our exclusive list of net cash growth stocks, today.
Valuation is complex, but we're here to simplify it.
Discover if Nitori Holdings might be undervalued or overvalued with our detailed analysis, featuring fair value estimates, potential risks, dividends, insider trades, and its financial condition.
Access Free AnalysisHave feedback on this article? Concerned about the content? Get in touch with us directly. Alternatively, email editorial-team (at) simplywallst.com.
This article by Simply Wall St is general in nature. We provide commentary based on historical data and analyst forecasts only using an unbiased methodology and our articles are not intended to be financial advice. It does not constitute a recommendation to buy or sell any stock, and does not take account of your objectives, or your financial situation. We aim to bring you long-term focused analysis driven by fundamental data. Note that our analysis may not factor in the latest price-sensitive company announcements or qualitative material. Simply Wall St has no position in any stocks mentioned.
About TSE:9843
Nitori Holdings
Engages in the retail of furniture and interior products in Japan.
Excellent balance sheet average dividend payer.
Similar Companies
Market Insights

Advertisement
Community Narratives
MicroVision will explode future revenue by 380.37% with a vision towards success
Fair Value US$60.00|98.5% undervalued
TH
Community Contributor
The Indispensable Artery for a New North American Economy
Fair Value CA$132.87|2.3% undervalued
TI
Community Contributor