
Advertisement
- Japan
- /
- Specialty Stores
- /
- TSE:3779
With A 27% Price Drop For J Escom Holdings,Inc. (TSE:3779) You'll Still Get What You Pay For
To the annoyance of some shareholders, J Escom Holdings,Inc. (TSE:3779) shares are down a considerable 27% in the last month, which continues a horrid run for the company. Looking at the bigger picture, even after this poor month the stock is up 40% in the last year.
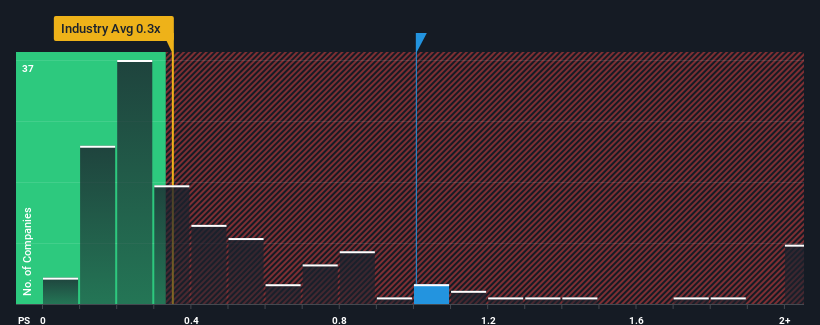
In spite of the heavy fall in price, given close to half the companies operating in Japan's Specialty Retail industry have price-to-sales ratios (or "P/S") below 0.3x, you may still consider J Escom HoldingsInc as a stock to potentially avoid with its 1x P/S ratio. Nonetheless, we'd need to dig a little deeper to determine if there is a rational basis for the elevated P/S.
Check out our latest analysis for J Escom HoldingsInc
What Does J Escom HoldingsInc's Recent Performance Look Like?
J Escom HoldingsInc certainly has been doing a great job lately as it's been growing its revenue at a really rapid pace. It seems that many are expecting the strong revenue performance to beat most other companies over the coming period, which has increased investors’ willingness to pay up for the stock. However, if this isn't the case, investors might get caught out paying too much for the stock.
Want the full picture on earnings, revenue and cash flow for the company? Then our free report on J Escom HoldingsInc will help you shine a light on its historical performance.Is There Enough Revenue Growth Forecasted For J Escom HoldingsInc?
The only time you'd be truly comfortable seeing a P/S as high as J Escom HoldingsInc's is when the company's growth is on track to outshine the industry.
Retrospectively, the last year delivered an exceptional 48% gain to the company's top line. The strong recent performance means it was also able to grow revenue by 73% in total over the last three years. Accordingly, shareholders would have definitely welcomed those medium-term rates of revenue growth.
Comparing that recent medium-term revenue trajectory with the industry's one-year growth forecast of 7.9% shows it's noticeably more attractive.
With this in consideration, it's not hard to understand why J Escom HoldingsInc's P/S is high relative to its industry peers. It seems most investors are expecting this strong growth to continue and are willing to pay more for the stock.
The Final Word
J Escom HoldingsInc's P/S remain high even after its stock plunged. Typically, we'd caution against reading too much into price-to-sales ratios when settling on investment decisions, though it can reveal plenty about what other market participants think about the company.
It's no surprise that J Escom HoldingsInc can support its high P/S given the strong revenue growth its experienced over the last three-year is superior to the current industry outlook. At this stage investors feel the potential continued revenue growth in the future is great enough to warrant an inflated P/S. If recent medium-term revenue trends continue, it's hard to see the share price falling strongly in the near future under these circumstances.
Don't forget that there may be other risks. For instance, we've identified 3 warning signs for J Escom HoldingsInc (2 are significant) you should be aware of.
If strong companies turning a profit tickle your fancy, then you'll want to check out this free list of interesting companies that trade on a low P/E (but have proven they can grow earnings).
New: Manage All Your Stock Portfolios in One Place
We've created the ultimate portfolio companion for stock investors, and it's free.
• Connect an unlimited number of Portfolios and see your total in one currency
• Be alerted to new Warning Signs or Risks via email or mobile
• Track the Fair Value of your stocks
Have feedback on this article? Concerned about the content? Get in touch with us directly. Alternatively, email editorial-team (at) simplywallst.com.
This article by Simply Wall St is general in nature. We provide commentary based on historical data and analyst forecasts only using an unbiased methodology and our articles are not intended to be financial advice. It does not constitute a recommendation to buy or sell any stock, and does not take account of your objectives, or your financial situation. We aim to bring you long-term focused analysis driven by fundamental data. Note that our analysis may not factor in the latest price-sensitive company announcements or qualitative material. Simply Wall St has no position in any stocks mentioned.
About TSE:3779
J Escom HoldingsInc
Through its subsidiaries, engages in the sale of hairdressing and beauty consumables to hairdressers and esthetic salons in Japan and South Korea.
Acceptable track record with mediocre balance sheet.
Market Insights

Advertisement
Community Narratives
MicroVision will explode future revenue by 380.37% with a vision towards success
Fair Value US$60.00|98.5% undervalued
TH
Community Contributor
The Indispensable Artery for a New North American Economy
Fair Value CA$132.87|2.3% undervalued
TI
Community Contributor