
Advertisement
- Japan
- /
- Specialty Stores
- /
- TSE:3192
There's Reason For Concern Over Shirohato Co., Ltd.'s (TSE:3192) Massive 26% Price Jump
Shirohato Co., Ltd. (TSE:3192) shareholders would be excited to see that the share price has had a great month, posting a 26% gain and recovering from prior weakness. Notwithstanding the latest gain, the annual share price return of 3.9% isn't as impressive.
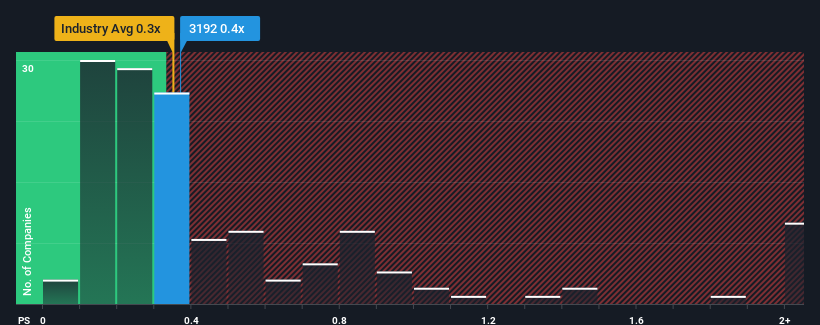
Even after such a large jump in price, there still wouldn't be many who think Shirohato's price-to-sales (or "P/S") ratio of 0.4x is worth a mention when the median P/S in Japan's Specialty Retail industry is similar at about 0.3x. However, investors might be overlooking a clear opportunity or potential setback if there is no rational basis for the P/S.
Check out our latest analysis for Shirohato
What Does Shirohato's P/S Mean For Shareholders?
As an illustration, revenue has deteriorated at Shirohato over the last year, which is not ideal at all. One possibility is that the P/S is moderate because investors think the company might still do enough to be in line with the broader industry in the near future. If you like the company, you'd at least be hoping this is the case so that you could potentially pick up some stock while it's not quite in favour.
Want the full picture on earnings, revenue and cash flow for the company? Then our free report on Shirohato will help you shine a light on its historical performance.How Is Shirohato's Revenue Growth Trending?
The only time you'd be comfortable seeing a P/S like Shirohato's is when the company's growth is tracking the industry closely.
Taking a look back first, the company's revenue growth last year wasn't something to get excited about as it posted a disappointing decline of 1.0%. That put a dampener on the good run it was having over the longer-term as its three-year revenue growth is still a noteworthy 5.1% in total. Although it's been a bumpy ride, it's still fair to say the revenue growth recently has been mostly respectable for the company.
Comparing the recent medium-term revenue trends against the industry's one-year growth forecast of 8.2% shows it's noticeably less attractive.
In light of this, it's curious that Shirohato's P/S sits in line with the majority of other companies. It seems most investors are ignoring the fairly limited recent growth rates and are willing to pay up for exposure to the stock. Maintaining these prices will be difficult to achieve as a continuation of recent revenue trends is likely to weigh down the shares eventually.
What Does Shirohato's P/S Mean For Investors?
Its shares have lifted substantially and now Shirohato's P/S is back within range of the industry median. Typically, we'd caution against reading too much into price-to-sales ratios when settling on investment decisions, though it can reveal plenty about what other market participants think about the company.
Our examination of Shirohato revealed its poor three-year revenue trends aren't resulting in a lower P/S as per our expectations, given they look worse than current industry outlook. Right now we are uncomfortable with the P/S as this revenue performance isn't likely to support a more positive sentiment for long. Unless the recent medium-term conditions improve, it's hard to accept the current share price as fair value.
And what about other risks? Every company has them, and we've spotted 3 warning signs for Shirohato (of which 2 can't be ignored!) you should know about.
If these risks are making you reconsider your opinion on Shirohato, explore our interactive list of high quality stocks to get an idea of what else is out there.
New: Manage All Your Stock Portfolios in One Place
We've created the ultimate portfolio companion for stock investors, and it's free.
• Connect an unlimited number of Portfolios and see your total in one currency
• Be alerted to new Warning Signs or Risks via email or mobile
• Track the Fair Value of your stocks
Have feedback on this article? Concerned about the content? Get in touch with us directly. Alternatively, email editorial-team (at) simplywallst.com.
This article by Simply Wall St is general in nature. We provide commentary based on historical data and analyst forecasts only using an unbiased methodology and our articles are not intended to be financial advice. It does not constitute a recommendation to buy or sell any stock, and does not take account of your objectives, or your financial situation. We aim to bring you long-term focused analysis driven by fundamental data. Note that our analysis may not factor in the latest price-sensitive company announcements or qualitative material. Simply Wall St has no position in any stocks mentioned.
About TSE:3192
Good value with acceptable track record.
Market Insights

Advertisement
Community Narratives
MicroVision will explode future revenue by 380.37% with a vision towards success
Fair Value US$60.00|98.4% undervalued
TH
Community Contributor
The Indispensable Artery for a New North American Economy
Fair Value CA$132.87|1.3% undervalued
TI
Community Contributor