Isetan Mitsukoshi Holdings (TSE:3099) shareholder returns have been solid, earning 213% in 3 years

It hasn't been the best quarter for Isetan Mitsukoshi Holdings Ltd. (TSE:3099) shareholders, since the share price has fallen 29% in that time. But that doesn't undermine the rather lovely longer-term return, if you measure over the last three years. Indeed, the share price is up a very strong 200% in that time. After a run like that some may not be surprised to see prices moderate. Only time will tell if there is still too much optimism currently reflected in the share price.
The past week has proven to be lucrative for Isetan Mitsukoshi Holdings investors, so let's see if fundamentals drove the company's three-year performance.
See our latest analysis for Isetan Mitsukoshi Holdings
While markets are a powerful pricing mechanism, share prices reflect investor sentiment, not just underlying business performance. By comparing earnings per share (EPS) and share price changes over time, we can get a feel for how investor attitudes to a company have morphed over time.
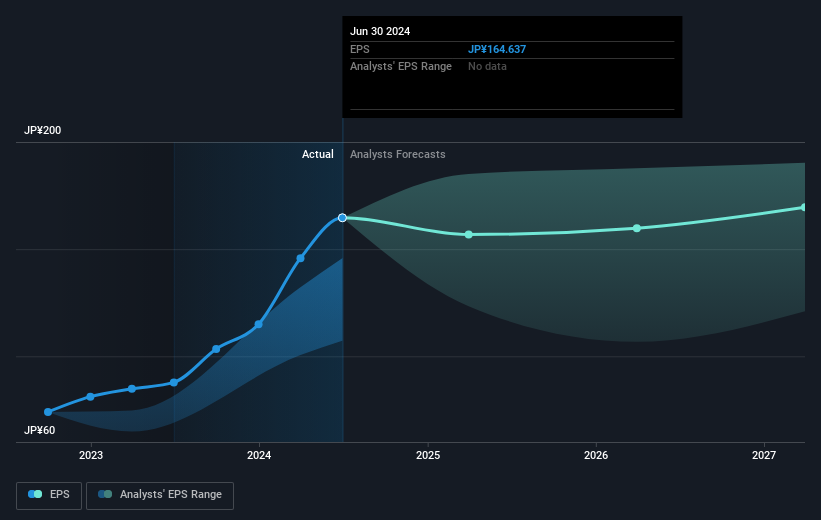
During three years of share price growth, Isetan Mitsukoshi Holdings moved from a loss to profitability. Given the importance of this milestone, it's not overly surprising that the share price has increased strongly.
You can see how EPS has changed over time in the image below (click on the chart to see the exact values).
We know that Isetan Mitsukoshi Holdings has improved its bottom line over the last three years, but what does the future have in store? This free interactive report on Isetan Mitsukoshi Holdings' balance sheet strength is a great place to start, if you want to investigate the stock further.
What About Dividends?
It is important to consider the total shareholder return, as well as the share price return, for any given stock. Whereas the share price return only reflects the change in the share price, the TSR includes the value of dividends (assuming they were reinvested) and the benefit of any discounted capital raising or spin-off. Arguably, the TSR gives a more comprehensive picture of the return generated by a stock. As it happens, Isetan Mitsukoshi Holdings' TSR for the last 3 years was 213%, which exceeds the share price return mentioned earlier. And there's no prize for guessing that the dividend payments largely explain the divergence!
A Different Perspective
It's nice to see that Isetan Mitsukoshi Holdings shareholders have received a total shareholder return of 47% over the last year. And that does include the dividend. That's better than the annualised return of 25% over half a decade, implying that the company is doing better recently. In the best case scenario, this may hint at some real business momentum, implying that now could be a great time to delve deeper. It's always interesting to track share price performance over the longer term. But to understand Isetan Mitsukoshi Holdings better, we need to consider many other factors. To that end, you should learn about the 2 warning signs we've spotted with Isetan Mitsukoshi Holdings (including 1 which is significant) .
If you would prefer to check out another company -- one with potentially superior financials -- then do not miss this free list of companies that have proven they can grow earnings.
Please note, the market returns quoted in this article reflect the market weighted average returns of stocks that currently trade on Japanese exchanges.
New: AI Stock Screener & Alerts
Our new AI Stock Screener scans the market every day to uncover opportunities.
• Dividend Powerhouses (3%+ Yield)
• Undervalued Small Caps with Insider Buying
• High growth Tech and AI Companies
Or build your own from over 50 metrics.
Have feedback on this article? Concerned about the content? Get in touch with us directly. Alternatively, email editorial-team (at) simplywallst.com.
This article by Simply Wall St is general in nature. We provide commentary based on historical data and analyst forecasts only using an unbiased methodology and our articles are not intended to be financial advice. It does not constitute a recommendation to buy or sell any stock, and does not take account of your objectives, or your financial situation. We aim to bring you long-term focused analysis driven by fundamental data. Note that our analysis may not factor in the latest price-sensitive company announcements or qualitative material. Simply Wall St has no position in any stocks mentioned.
About TSE:3099
Isetan Mitsukoshi Holdings
Engages in the department store business in Japan and internationally.
Solid track record with excellent balance sheet and pays a dividend.

