
Advertisement
Did you know there are some financial metrics that can provide clues of a potential multi-bagger? Ideally, a business will show two trends; firstly a growing return on capital employed (ROCE) and secondly, an increasing amount of capital employed. Basically this means that a company has profitable initiatives that it can continue to reinvest in, which is a trait of a compounding machine. Having said that, while the ROCE is currently high for JINS HOLDINGS (TSE:3046), we aren't jumping out of our chairs because returns are decreasing.
What Is Return On Capital Employed (ROCE)?
Just to clarify if you're unsure, ROCE is a metric for evaluating how much pre-tax income (in percentage terms) a company earns on the capital invested in its business. To calculate this metric for JINS HOLDINGS, this is the formula:
Return on Capital Employed = Earnings Before Interest and Tax (EBIT) ÷ (Total Assets - Current Liabilities)
0.24 = JP¥6.2b ÷ (JP¥49b - JP¥23b) (Based on the trailing twelve months to May 2024).
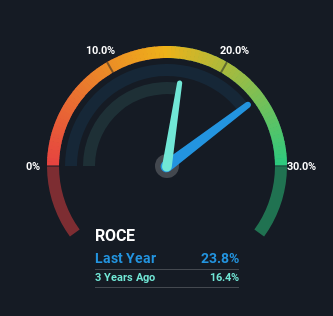
Thus, JINS HOLDINGS has an ROCE of 24%. In absolute terms that's a great return and it's even better than the Specialty Retail industry average of 11%.
Check out our latest analysis for JINS HOLDINGS
In the above chart we have measured JINS HOLDINGS' prior ROCE against its prior performance, but the future is arguably more important. If you'd like, you can check out the forecasts from the analysts covering JINS HOLDINGS for free.
What The Trend Of ROCE Can Tell Us
There hasn't been much to report for JINS HOLDINGS' returns and its level of capital employed because both metrics have been steady for the past five years. Businesses with these traits tend to be mature and steady operations because they're past the growth phase. Although current returns are high, we'd need more evidence of underlying growth for it to look like a multi-bagger going forward.
Another point to note, we noticed the company has increased current liabilities over the last five years. This is intriguing because if current liabilities hadn't increased to 46% of total assets, this reported ROCE would probably be less than24% because total capital employed would be higher.The 24% ROCE could be even lower if current liabilities weren't 46% of total assets, because the the formula would show a larger base of total capital employed. Additionally, this high level of current liabilities isn't ideal because it means the company's suppliers (or short-term creditors) are effectively funding a large portion of the business.
Our Take On JINS HOLDINGS' ROCE
In summary, JINS HOLDINGS isn't compounding its earnings but is generating decent returns on the same amount of capital employed. And in the last five years, the stock has given away 17% so the market doesn't look too hopeful on these trends strengthening any time soon. On the whole, we aren't too inspired by the underlying trends and we think there may be better chances of finding a multi-bagger elsewhere.
If you're still interested in JINS HOLDINGS it's worth checking out our FREE intrinsic value approximation for 3046 to see if it's trading at an attractive price in other respects.
High returns are a key ingredient to strong performance, so check out our free list ofstocks earning high returns on equity with solid balance sheets.
New: Manage All Your Stock Portfolios in One Place
We've created the ultimate portfolio companion for stock investors, and it's free.
• Connect an unlimited number of Portfolios and see your total in one currency
• Be alerted to new Warning Signs or Risks via email or mobile
• Track the Fair Value of your stocks
Have feedback on this article? Concerned about the content? Get in touch with us directly. Alternatively, email editorial-team (at) simplywallst.com.
This article by Simply Wall St is general in nature. We provide commentary based on historical data and analyst forecasts only using an unbiased methodology and our articles are not intended to be financial advice. It does not constitute a recommendation to buy or sell any stock, and does not take account of your objectives, or your financial situation. We aim to bring you long-term focused analysis driven by fundamental data. Note that our analysis may not factor in the latest price-sensitive company announcements or qualitative material. Simply Wall St has no position in any stocks mentioned.
About TSE:3046
JINS HOLDINGS
Through its subsidiaries, engages in the planning, manufacturing, sales, and import/export of eyewear in Japan and internationally.
Outstanding track record with flawless balance sheet.
Market Insights

Advertisement
Community Narratives
The company that turned a verb into a global necessity and basically runs the modern internet, digital ads, smartphones, maps, and AI.
Fair Value US$300.00|6.3% undervalued
OS
Community Contributor
Flowers Foods Pays A Fair Price For Health
Fair Value US$16.12|26.0% undervalued
NV
Community Contributor
TMX Group will thrive with 33.3% profit margin and enduring market moat
Fair Value CA$49.90|3.7% overvalued
LI
Community Contributor