
Advertisement
- Japan
- /
- Specialty Stores
- /
- TSE:3046
JINS HOLDINGS Inc.'s (TSE:3046) most bullish insider is CEO Hitoshi Tanaka, and their holdings value went up by 18% last week
Key Insights
- Significant insider control over JINS HOLDINGS implies vested interests in company growth
- A total of 4 investors have a majority stake in the company with 52% ownership
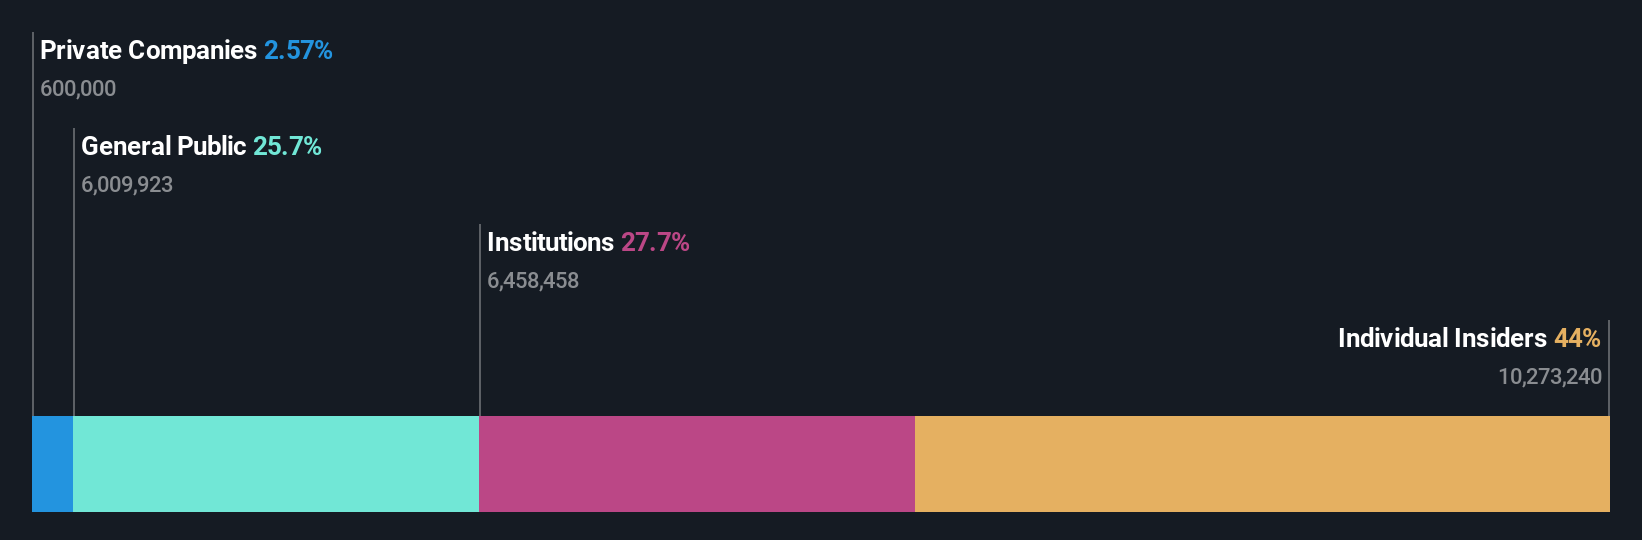
- 28% of JINS HOLDINGS is held by Institutions
To get a sense of who is truly in control of JINS HOLDINGS Inc. (TSE:3046), it is important to understand the ownership structure of the business. And the group that holds the biggest piece of the pie are individual insiders with 44% ownership. Put another way, the group faces the maximum upside potential (or downside risk).
As a result, insiders scored the highest last week as the company hit JP¥223b market cap following a 18% gain in the stock.
Let's take a closer look to see what the different types of shareholders can tell us about JINS HOLDINGS.
See our latest analysis for JINS HOLDINGS
What Does The Institutional Ownership Tell Us About JINS HOLDINGS?
Many institutions measure their performance against an index that approximates the local market. So they usually pay more attention to companies that are included in major indices.
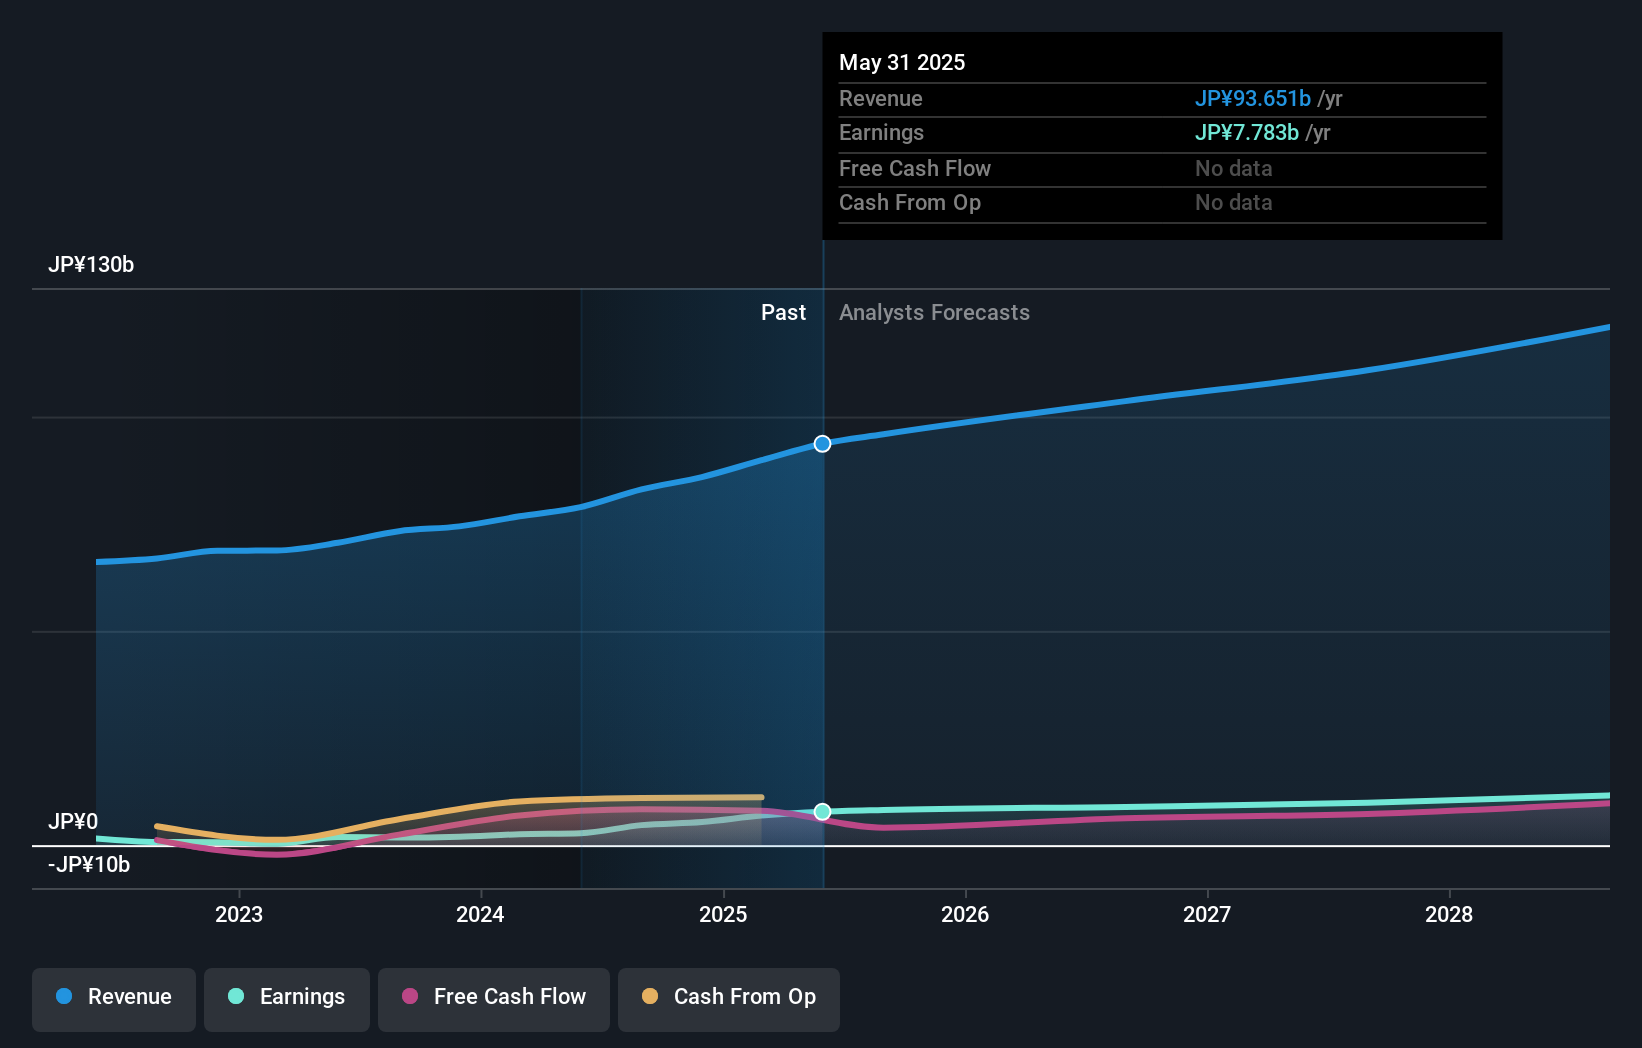
As you can see, institutional investors have a fair amount of stake in JINS HOLDINGS. This suggests some credibility amongst professional investors. But we can't rely on that fact alone since institutions make bad investments sometimes, just like everyone does. If multiple institutions change their view on a stock at the same time, you could see the share price drop fast. It's therefore worth looking at JINS HOLDINGS' earnings history below. Of course, the future is what really matters.
We note that hedge funds don't have a meaningful investment in JINS HOLDINGS. Looking at our data, we can see that the largest shareholder is the CEO Hitoshi Tanaka with 40% of shares outstanding. Taiyo Pacific Partners L.P. is the second largest shareholder owning 5.3% of common stock, and Sumitomo Mitsui Financial Group Inc., Asset Management Arm holds about 3.6% of the company stock.
On looking further, we found that 52% of the shares are owned by the top 4 shareholders. In other words, these shareholders have a meaningful say in the decisions of the company.
While it makes sense to study institutional ownership data for a company, it also makes sense to study analyst sentiments to know which way the wind is blowing. There are a reasonable number of analysts covering the stock, so it might be useful to find out their aggregate view on the future.
Insider Ownership Of JINS HOLDINGS
While the precise definition of an insider can be subjective, almost everyone considers board members to be insiders. Management ultimately answers to the board. However, it is not uncommon for managers to be executive board members, especially if they are a founder or the CEO.
Insider ownership is positive when it signals leadership are thinking like the true owners of the company. However, high insider ownership can also give immense power to a small group within the company. This can be negative in some circumstances.
It seems insiders own a significant proportion of JINS HOLDINGS Inc.. It is very interesting to see that insiders have a meaningful JP¥98b stake in this JP¥223b business. Most would say this shows a good degree of alignment with shareholders, especially in a company of this size. You can click here to see if those insiders have been buying or selling.
General Public Ownership
The general public-- including retail investors -- own 26% stake in the company, and hence can't easily be ignored. While this size of ownership may not be enough to sway a policy decision in their favour, they can still make a collective impact on company policies.
Next Steps:
While it is well worth considering the different groups that own a company, there are other factors that are even more important. To that end, you should be aware of the 1 warning sign we've spotted with JINS HOLDINGS .
But ultimately it is the future, not the past, that will determine how well the owners of this business will do. Therefore we think it advisable to take a look at this free report showing whether analysts are predicting a brighter future.
NB: Figures in this article are calculated using data from the last twelve months, which refer to the 12-month period ending on the last date of the month the financial statement is dated. This may not be consistent with full year annual report figures.
New: Manage All Your Stock Portfolios in One Place
We've created the ultimate portfolio companion for stock investors, and it's free.
• Connect an unlimited number of Portfolios and see your total in one currency
• Be alerted to new Warning Signs or Risks via email or mobile
• Track the Fair Value of your stocks
Have feedback on this article? Concerned about the content? Get in touch with us directly. Alternatively, email editorial-team (at) simplywallst.com.
This article by Simply Wall St is general in nature. We provide commentary based on historical data and analyst forecasts only using an unbiased methodology and our articles are not intended to be financial advice. It does not constitute a recommendation to buy or sell any stock, and does not take account of your objectives, or your financial situation. We aim to bring you long-term focused analysis driven by fundamental data. Note that our analysis may not factor in the latest price-sensitive company announcements or qualitative material. Simply Wall St has no position in any stocks mentioned.
About TSE:3046
JINS HOLDINGS
Through its subsidiaries, engages in the planning, manufacturing, sales, and import/export of eyewear in Japan and internationally.
Outstanding track record with flawless balance sheet.
Similar Companies
Market Insights

Advertisement
Community Narratives
The company that turned a verb into a global necessity and basically runs the modern internet, digital ads, smartphones, maps, and AI.
Fair Value US$300.00|7.5% undervalued
OS
Community Contributor
Flowers Foods Pays A Fair Price For Health
Fair Value US$16.12|25.4% undervalued
NV
Community Contributor
TMX Group will thrive with 33.3% profit margin and enduring market moat
Fair Value CA$49.90|3.6% overvalued
LI
Community Contributor
The "Molecular Pencil": Why Beam's Technology is Built to Win
Fair Value US$65.01|65.0% undervalued
DA
Community Contributor