- Japan
- /
- Real Estate
- /
- TSE:8804
Tokyo Tatemono (TSE:8804) jumps 3.4% this week, though earnings growth is still tracking behind five-year shareholder returns


Stock pickers are generally looking for stocks that will outperform the broader market. And in our experience, buying the right stocks can give your wealth a significant boost. For example, long term Tokyo Tatemono Co., Ltd. (TSE:8804) shareholders have enjoyed a 99% share price rise over the last half decade, well in excess of the market return of around 67% (not including dividends). However, more recent returns haven't been as impressive as that, with the stock returning just 42% in the last year, including dividends.
After a strong gain in the past week, it's worth seeing if longer term returns have been driven by improving fundamentals.
See our latest analysis for Tokyo Tatemono
While the efficient markets hypothesis continues to be taught by some, it has been proven that markets are over-reactive dynamic systems, and investors are not always rational. One flawed but reasonable way to assess how sentiment around a company has changed is to compare the earnings per share (EPS) with the share price.
During five years of share price growth, Tokyo Tatemono achieved compound earnings per share (EPS) growth of 13% per year. This EPS growth is reasonably close to the 15% average annual increase in the share price. Therefore one could conclude that sentiment towards the shares hasn't morphed very much. Indeed, it would appear the share price is reacting to the EPS.
The image below shows how EPS has tracked over time (if you click on the image you can see greater detail).
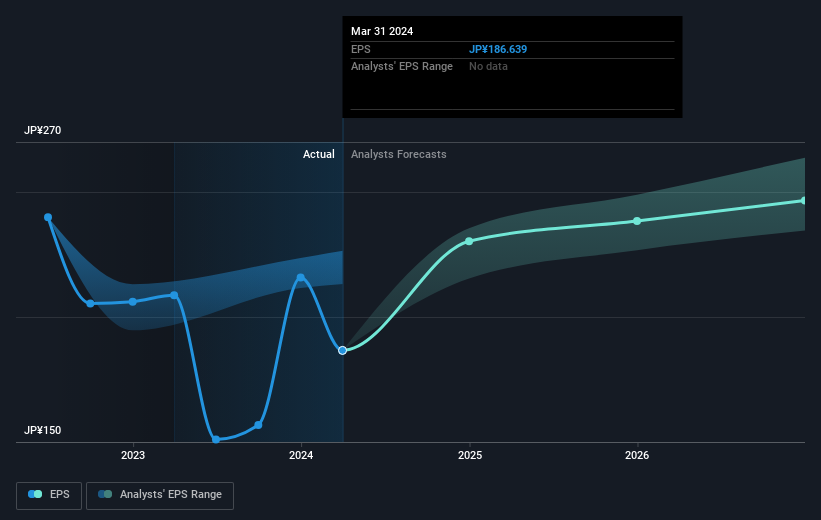
It might be well worthwhile taking a look at our free report on Tokyo Tatemono's earnings, revenue and cash flow.
What About Dividends?
When looking at investment returns, it is important to consider the difference between total shareholder return (TSR) and share price return. The TSR is a return calculation that accounts for the value of cash dividends (assuming that any dividend received was reinvested) and the calculated value of any discounted capital raisings and spin-offs. It's fair to say that the TSR gives a more complete picture for stocks that pay a dividend. We note that for Tokyo Tatemono the TSR over the last 5 years was 135%, which is better than the share price return mentioned above. And there's no prize for guessing that the dividend payments largely explain the divergence!
A Different Perspective
It's good to see that Tokyo Tatemono has rewarded shareholders with a total shareholder return of 42% in the last twelve months. That's including the dividend. That gain is better than the annual TSR over five years, which is 19%. Therefore it seems like sentiment around the company has been positive lately. Someone with an optimistic perspective could view the recent improvement in TSR as indicating that the business itself is getting better with time. I find it very interesting to look at share price over the long term as a proxy for business performance. But to truly gain insight, we need to consider other information, too. Like risks, for instance. Every company has them, and we've spotted 2 warning signs for Tokyo Tatemono (of which 1 doesn't sit too well with us!) you should know about.
If you are like me, then you will not want to miss this free list of undervalued small caps that insiders are buying.
Please note, the market returns quoted in this article reflect the market weighted average returns of stocks that currently trade on Japanese exchanges.
Valuation is complex, but we're here to simplify it.
Discover if Tokyo Tatemono might be undervalued or overvalued with our detailed analysis, featuring fair value estimates, potential risks, dividends, insider trades, and its financial condition.
Access Free AnalysisHave feedback on this article? Concerned about the content? Get in touch with us directly. Alternatively, email editorial-team (at) simplywallst.com.
This article by Simply Wall St is general in nature. We provide commentary based on historical data and analyst forecasts only using an unbiased methodology and our articles are not intended to be financial advice. It does not constitute a recommendation to buy or sell any stock, and does not take account of your objectives, or your financial situation. We aim to bring you long-term focused analysis driven by fundamental data. Note that our analysis may not factor in the latest price-sensitive company announcements or qualitative material. Simply Wall St has no position in any stocks mentioned.
Have feedback on this article? Concerned about the content? Get in touch with us directly. Alternatively, email editorial-team@simplywallst.com
About TSE:8804
Undervalued with solid track record and pays a dividend.

