- Japan
- /
- Real Estate
- /
- TSE:3498
Kasumigaseki CapitalLtd's (TSE:3498) five-year earnings growth trails the 58% YoY shareholder returns


Kasumigaseki Capital Co.,Ltd. (TSE:3498) shareholders might be concerned after seeing the share price drop 19% in the last quarter. But over five years returns have been remarkably great. Indeed, the share price is up a whopping 832% in that time. So we don't think the recent decline in the share price means its story is a sad one. Only time will tell if there is still too much optimism currently reflected in the share price. Anyone who held for that rewarding ride would probably be keen to talk about it.
On the back of a solid 7-day performance, let's check what role the company's fundamentals have played in driving long term shareholder returns.
View our latest analysis for Kasumigaseki CapitalLtd
In his essay The Superinvestors of Graham-and-Doddsville Warren Buffett described how share prices do not always rationally reflect the value of a business. By comparing earnings per share (EPS) and share price changes over time, we can get a feel for how investor attitudes to a company have morphed over time.
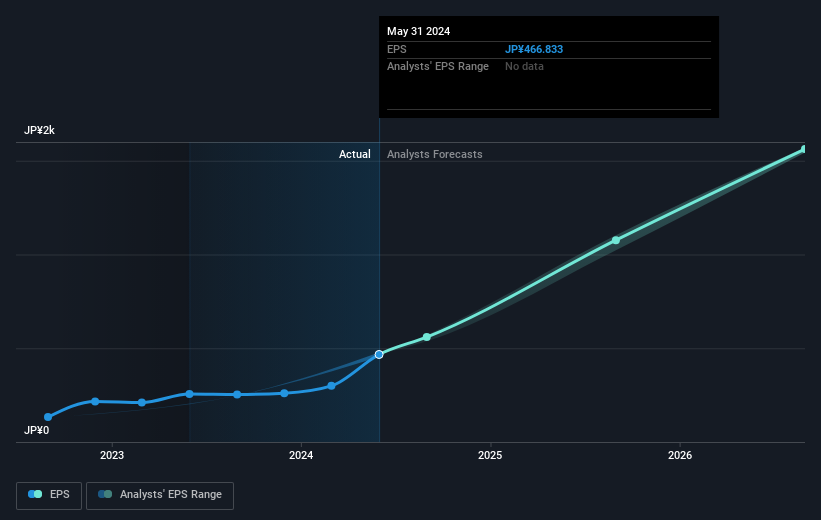
During five years of share price growth, Kasumigaseki CapitalLtd achieved compound earnings per share (EPS) growth of 21% per year. This EPS growth is slower than the share price growth of 56% per year, over the same period. This suggests that market participants hold the company in higher regard, these days. And that's hardly shocking given the track record of growth.
You can see below how EPS has changed over time (discover the exact values by clicking on the image).
It is of course excellent to see how Kasumigaseki CapitalLtd has grown profits over the years, but the future is more important for shareholders. If you are thinking of buying or selling Kasumigaseki CapitalLtd stock, you should check out this FREE detailed report on its balance sheet.
What About Dividends?
When looking at investment returns, it is important to consider the difference between total shareholder return (TSR) and share price return. Whereas the share price return only reflects the change in the share price, the TSR includes the value of dividends (assuming they were reinvested) and the benefit of any discounted capital raising or spin-off. So for companies that pay a generous dividend, the TSR is often a lot higher than the share price return. As it happens, Kasumigaseki CapitalLtd's TSR for the last 5 years was 873%, which exceeds the share price return mentioned earlier. The dividends paid by the company have thusly boosted the total shareholder return.
A Different Perspective
We're pleased to report that Kasumigaseki CapitalLtd shareholders have received a total shareholder return of 188% over one year. And that does include the dividend. That gain is better than the annual TSR over five years, which is 58%. Therefore it seems like sentiment around the company has been positive lately. Someone with an optimistic perspective could view the recent improvement in TSR as indicating that the business itself is getting better with time. I find it very interesting to look at share price over the long term as a proxy for business performance. But to truly gain insight, we need to consider other information, too. Even so, be aware that Kasumigaseki CapitalLtd is showing 3 warning signs in our investment analysis , and 2 of those shouldn't be ignored...
Of course, you might find a fantastic investment by looking elsewhere. So take a peek at this free list of companies we expect will grow earnings.
Please note, the market returns quoted in this article reflect the market weighted average returns of stocks that currently trade on Japanese exchanges.
Valuation is complex, but we're here to simplify it.
Discover if Kasumigaseki CapitalLtd might be undervalued or overvalued with our detailed analysis, featuring fair value estimates, potential risks, dividends, insider trades, and its financial condition.
Access Free AnalysisHave feedback on this article? Concerned about the content? Get in touch with us directly. Alternatively, email editorial-team (at) simplywallst.com.
This article by Simply Wall St is general in nature. We provide commentary based on historical data and analyst forecasts only using an unbiased methodology and our articles are not intended to be financial advice. It does not constitute a recommendation to buy or sell any stock, and does not take account of your objectives, or your financial situation. We aim to bring you long-term focused analysis driven by fundamental data. Note that our analysis may not factor in the latest price-sensitive company announcements or qualitative material. Simply Wall St has no position in any stocks mentioned.
About TSE:3498
Kasumigaseki CapitalLtd
Engages in real estate consulting businesses in Japan.
Exceptional growth potential with solid track record.
