Advertisement
Sumitomo Pharma (TSE:4506) Turns Profitable, Raising Questions on Sustainability of Positive Margins

Simply Wall St
Reviewed by Simply Wall St
Sumitomo Pharma (TSE:4506) has returned to profitability over the past year, with a marked improvement in net profit margins following a stretch of negative earnings. Revenue is forecast to grow at 5.3% per year, outpacing the Japanese pharmaceuticals market’s 4.5% average. However, EPS is expected to trend lower at an average rate of -21.2% per year over the next three years. This turn to positive margins and a low Price-To-Earnings Ratio of 4.3x compared to industry and peer averages suggests the stock is drawing attention from value-focused investors. The sustainability of recent profit gains remains in question given the outlook for declining earnings.
See our full analysis for Sumitomo Pharma.Next up, we will stack these headline numbers against the major narratives investors follow to see where the stories hold up and where they get challenged.
Curious how numbers become stories that shape markets? Explore Community Narratives
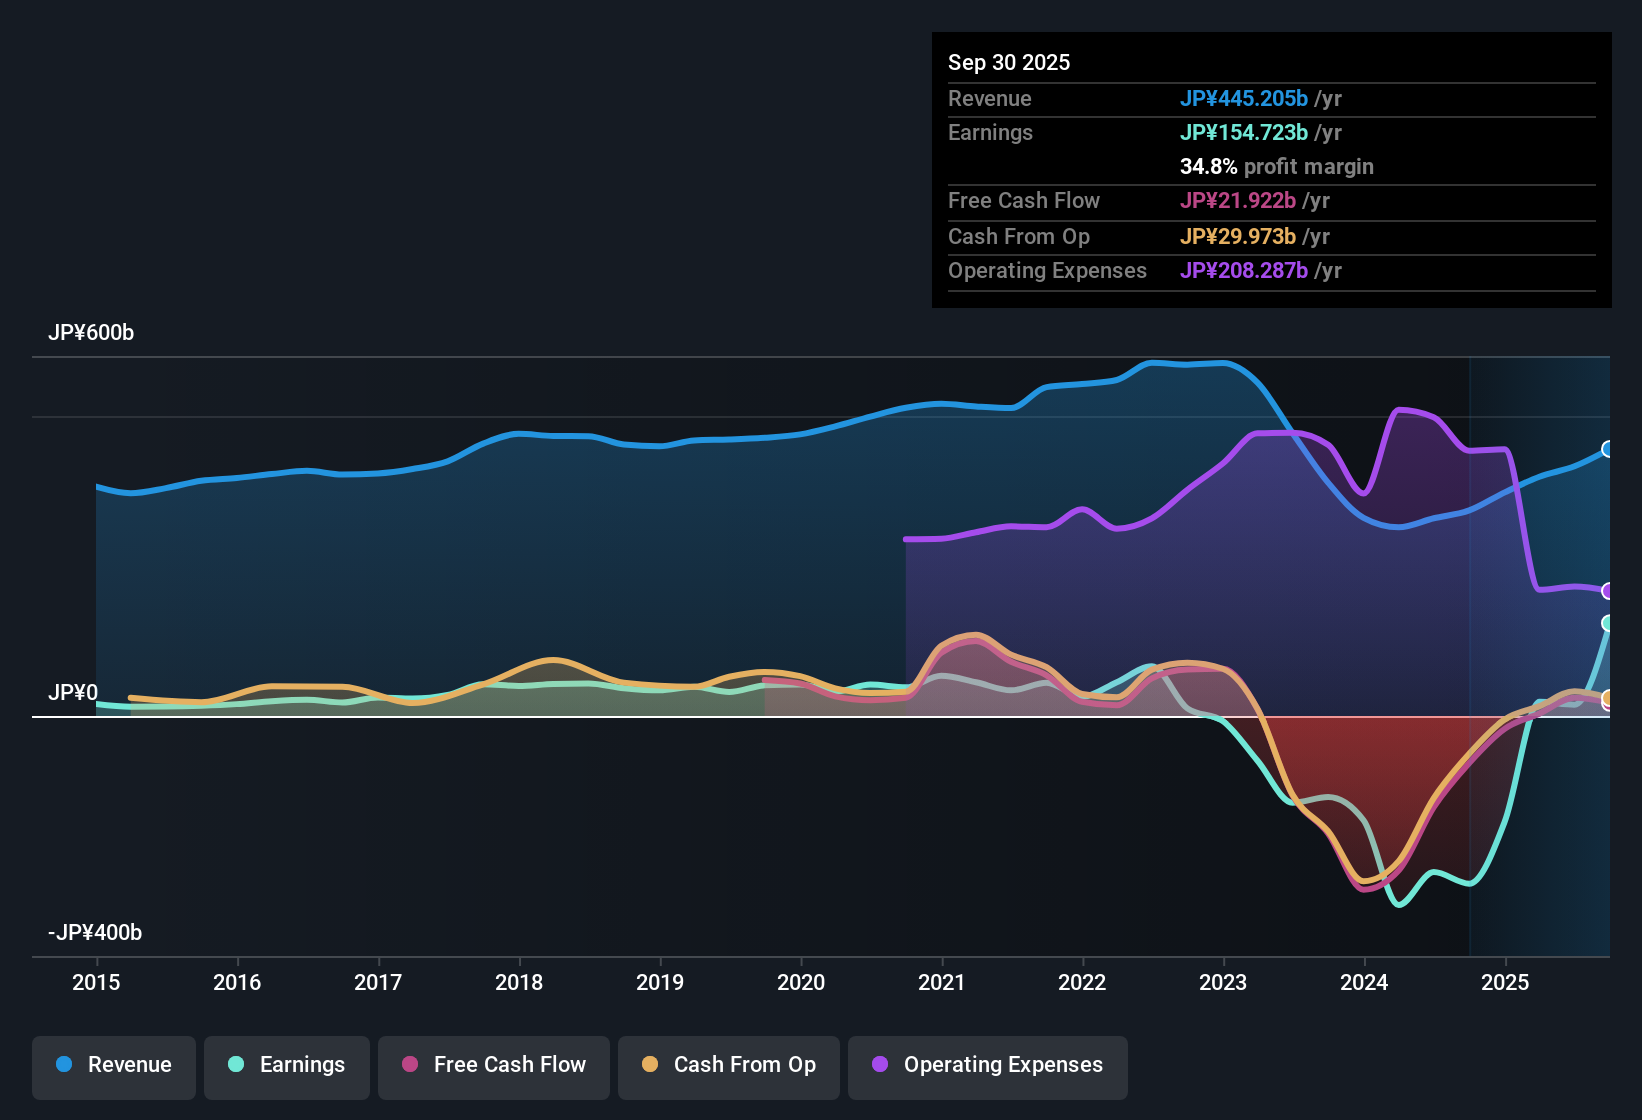
Net Margin Turns Positive as Profitability Returns
- Net profit margin has moved out of negative territory, signaling the company's first profitable year after a period of losses.
- The prevailing market view underscores this shift as closely watched by investors, citing:
- Positive net margins challenge earlier doubts about whether Sumitomo Pharma could restore operational earnings power. Skepticism remains, however, over whether the recent turnaround is durable given three-year earnings decline forecasts.
- The analysis emphasizes that while mainline profitability figures generate some optimism, risk-averse investors remain cautious as earnings are still expected to decrease at an average rate of -21.2% annually.
Non-Cash Earnings and Profit Sustainability Concerns
- A high reliance on non-cash earnings and an anticipated decline in future earnings draws attention to the sustainability of the company’s recent profitability.
- The prevailing market view notes persistent concerns, illustrated by:
- Although margin improvement lifts short-term results, instability in share price and weaker financial positioning highlight real vulnerabilities. Sumitomo Pharma lacks sustained positive revenue and earnings trends compared to leading sector peers.
- The shift to profitability, while notable, does not address flagged risks around future earnings quality, suggesting the need for caution even as some value metrics attract investors.
P/E Multiple and Fair Value Discount Stand Out
- Trading at a Price-To-Earnings Ratio of 4.3x, Sumitomo Pharma sits well below the industry average of 15.2x and the peer average of 23.4x. Its share price (¥1684.5) is significantly under the DCF fair value estimate of ¥4300.64.
- The prevailing market view flags this valuation gap as central to the investment debate, highlighting:
- The stark discount attracts recovery-focused and value-driven investors, who see the low P/E and undervalued share price as possible catalysts for upside if profitability proves sustainable.
- However, the same valuation can also reflect market doubts about the company’s ability to reverse declining earnings forecasts and resolve ongoing risks.
See our latest analysis for Sumitomo Pharma.
Next Steps
Don't just look at this quarter; the real story is in the long-term trend. We've done an in-depth analysis on Sumitomo Pharma's growth and its valuation to see if today's price is a bargain. Add the company to your watchlist or portfolio now so you don't miss the next big move.
See What Else Is Out There
Sumitomo Pharma’s uneven earnings outlook and unstable profitability raise concerns about future growth and the durability of recent positive margins.
Looking for companies with a proven track record of reliable performance instead? Check out stable growth stocks screener (2087 results) to find options delivering consistent growth through market cycles.
This article by Simply Wall St is general in nature. We provide commentary based on historical data and analyst forecasts only using an unbiased methodology and our articles are not intended to be financial advice. It does not constitute a recommendation to buy or sell any stock, and does not take account of your objectives, or your financial situation. We aim to bring you long-term focused analysis driven by fundamental data. Note that our analysis may not factor in the latest price-sensitive company announcements or qualitative material. Simply Wall St has no position in any stocks mentioned.
New: Manage All Your Stock Portfolios in One Place
We've created the ultimate portfolio companion for stock investors, and it's free.
• Connect an unlimited number of Portfolios and see your total in one currency
• Be alerted to new Warning Signs or Risks via email or mobile
• Track the Fair Value of your stocks
Have feedback on this article? Concerned about the content? Get in touch with us directly. Alternatively, email editorial-team@simplywallst.com
About TSE:4506
Sumitomo Pharma
Engages in manufacture, purchase, and sale of pharmaceutical products for medical treatment in Japan, North America, and Asia.
Undervalued with slight risk.
Similar Companies
Market Insights

Advertisement
Community Narratives
The company that turned a verb into a global necessity and basically runs the modern internet, digital ads, smartphones, maps, and AI.
Fair Value US$300.00|6.3% undervalued
OS
Community Contributor
Flowers Foods Pays A Fair Price For Health
Fair Value US$16.12|26.0% undervalued
NV
Community Contributor
TMX Group will thrive with 33.3% profit margin and enduring market moat
Fair Value CA$49.90|3.7% overvalued
LI
Community Contributor