Advertisement
A Look at TBS Holdings (TSE:9401) Valuation Following Upgraded Earnings and Dividend Guidance

Simply Wall St
Reviewed by Simply Wall St
TBS HoldingsInc (TSE:9401) lifted its full-year earnings and dividend forecasts following a strong rise in broadcasting revenue, with standout contributions from major events like the World Athletics Championships Tokyo 25 and resilient spot advertising. This move signals the company’s confidence in sustained improvement and commitment to enhanced shareholder returns.
See our latest analysis for TBS HoldingsInc.
TBS HoldingsInc’s refreshed earnings and dividend outlook has clearly fueled investor optimism, with the share price gaining over 45% so far this year. Momentum is building, as reflected in a remarkable 56% total shareholder return for the past twelve months and an even stronger three-year return above 275%. This highlights both short-term excitement and long-term value creation.
If the latest results from TBS HoldingsInc have caught your attention, now is a good opportunity to broaden your search and discover fast growing stocks with high insider ownership
Yet with TBS HoldingsInc shares already up sharply and dividend forecasts rising, investors face the key question: does the stock remain undervalued at these levels, or has the market already priced in future growth?
Price-to-Earnings of 15.8x: Is it justified?
TBS HoldingsInc currently trades at a price-to-earnings (P/E) ratio of 15.8x, placing the share price slightly above its peer average but below what advanced models see as its fair multiple. This suggests investors are paying a premium for every yen of earnings compared to some competitors, but perhaps less than the valuation models imply it could fetch.
The price-to-earnings ratio is a widely used gauge of whether a company's shares are rightly valued relative to its profit. For TBS HoldingsInc, this figure means investors are willing to pay 15.8 times the company's reported earnings over the past year. In media, this ratio reflects market expectations for stable profits and future earnings potential, making it closely watched among sector followers.
Examining the context, TBS HoldingsInc's P/E ratio is marginally higher than the peer group average of 15.2x. This means it commands a modest premium within its competitive set. However, our latest SWS analysis calculates a fair P/E of 24x. This indicates substantial headroom if the market realigns to this benchmark. The gap between the current multiple and the fair value multiple suggests there may be more potential upside, should investor sentiment shift or if earnings growth surprises on the upside.
Explore the SWS fair ratio for TBS HoldingsInc
Result: Price-to-Earnings of 15.8x (UNDERVALUED)
However, earnings momentum could falter if advertising demand softens or if net income continues to trend downward. This may limit further upside for the shares.
Find out about the key risks to this TBS HoldingsInc narrative.
Another View: SWS DCF Model Suggests Deeper Value
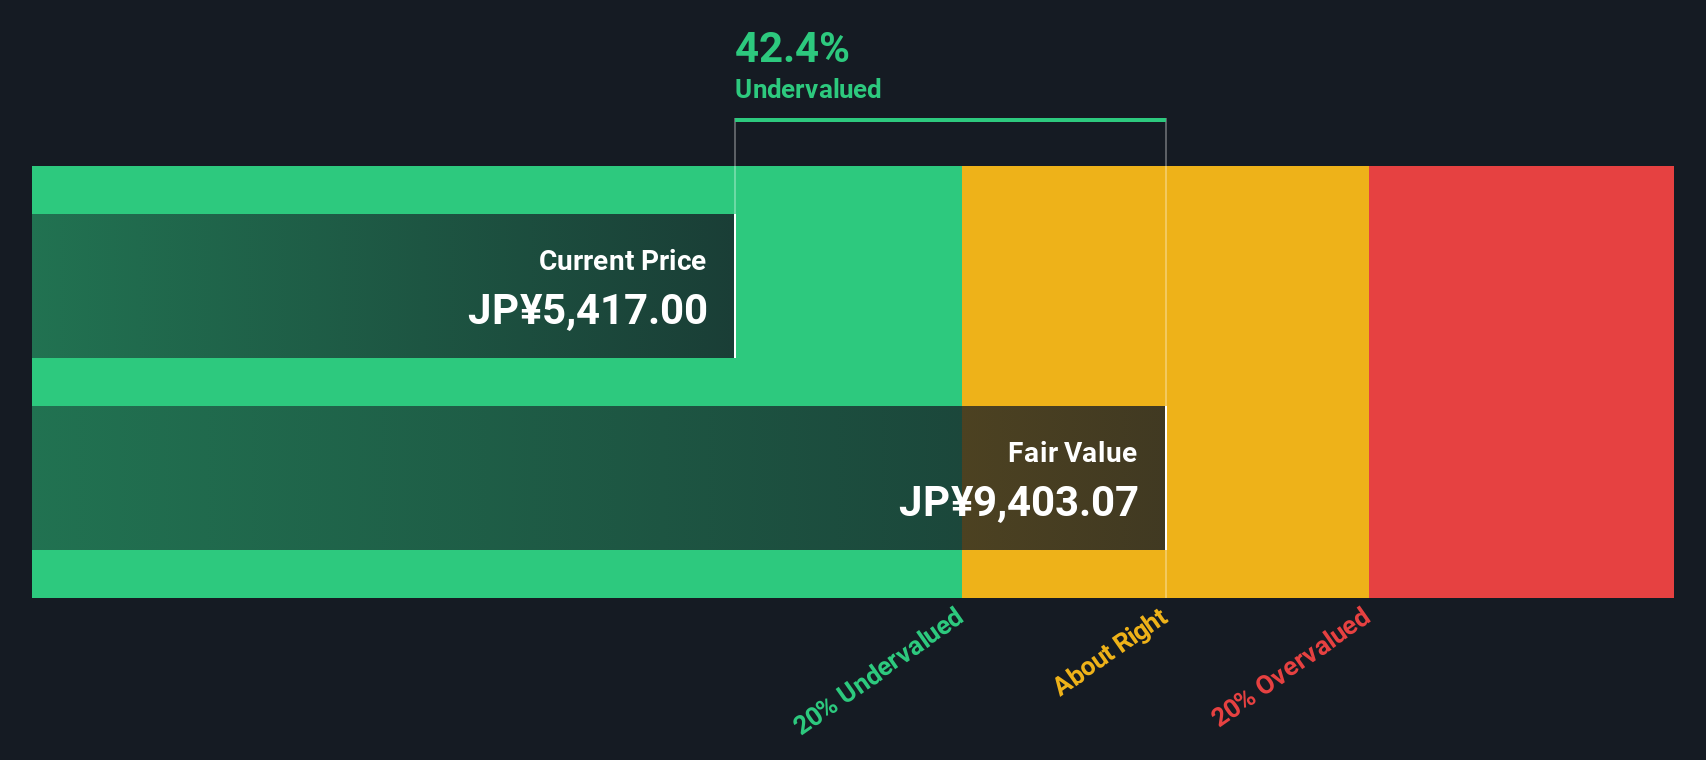
While the price-to-earnings ratio points to some undervaluation, our DCF model takes a broader view of cash flow and estimates TBS HoldingsInc shares are trading roughly 40% below intrinsic value. This represents a more dramatic discount than what the earnings-based multiple suggests. Could the DCF method be identifying something the market misses?
Look into how the SWS DCF model arrives at its fair value.
Simply Wall St performs a discounted cash flow (DCF) on every stock in the world every day (check out TBS HoldingsInc for example). We show the entire calculation in full. You can track the result in your watchlist or portfolio and be alerted when this changes, or use our stock screener to discover 928 undervalued stocks based on their cash flows. If you save a screener we even alert you when new companies match - so you never miss a potential opportunity.
Build Your Own TBS HoldingsInc Narrative
If you have a different perspective or want to dig deeper into the numbers yourself, it takes just a few minutes to build your own view and see where it leads. Do it your way
A great starting point for your TBS HoldingsInc research is our analysis highlighting 1 key reward and 2 important warning signs that could impact your investment decision.
Looking for More Investment Ideas?
Opportunities don’t stop with one company. With the right tools, you can target fast-growing markets and uncover hidden winners that others overlook every day.
- Catch strong yields for your portfolio by reviewing these 16 dividend stocks with yields > 3%, which offers reliable payouts above 3% and is backed by solid, consistent performance.
- Position yourself at the forefront of digital innovation by scouting these 26 AI penny stocks, which are poised for growth with advancements in artificial intelligence technology.
- Spot great value by searching these 928 undervalued stocks based on cash flows for stocks that the market may be overlooking based on their future cash flows.
This article by Simply Wall St is general in nature. We provide commentary based on historical data and analyst forecasts only using an unbiased methodology and our articles are not intended to be financial advice. It does not constitute a recommendation to buy or sell any stock, and does not take account of your objectives, or your financial situation. We aim to bring you long-term focused analysis driven by fundamental data. Note that our analysis may not factor in the latest price-sensitive company announcements or qualitative material. Simply Wall St has no position in any stocks mentioned.
Valuation is complex, but we're here to simplify it.
Discover if TBS HoldingsInc might be undervalued or overvalued with our detailed analysis, featuring fair value estimates, potential risks, dividends, insider trades, and its financial condition.
Access Free AnalysisHave feedback on this article? Concerned about the content? Get in touch with us directly. Alternatively, email editorial-team@simplywallst.com
About TSE:9401
TBS HoldingsInc
Engages in the broadcasting and real estate businesses primarily in Japan.
Good value with adequate balance sheet.
Market Insights

Advertisement
Community Narratives
MicroVision will explode future revenue by 380.37% with a vision towards success
Fair Value US$60.00|98.4% undervalued
TH
Community Contributor
The Indispensable Artery for a New North American Economy
Fair Value CA$132.87|1.3% undervalued
TI
Community Contributor