
Advertisement
Access Group Holdings Co., Ltd. (TSE:7042) Held Back By Insufficient Growth Even After Shares Climb 27%
Access Group Holdings Co., Ltd. (TSE:7042) shareholders have had their patience rewarded with a 27% share price jump in the last month. The last 30 days bring the annual gain to a very sharp 39%.
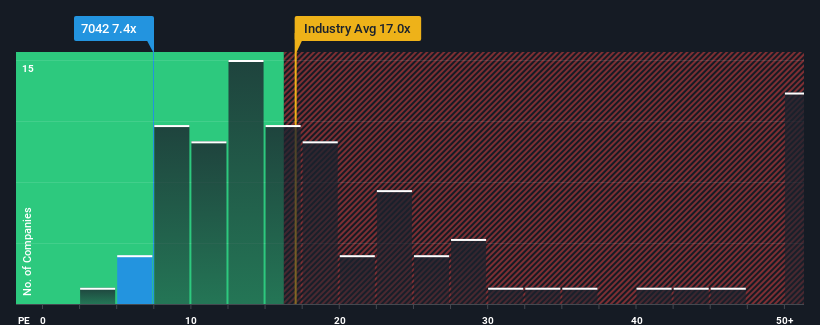
Although its price has surged higher, Access Group Holdings' price-to-earnings (or "P/E") ratio of 7.4x might still make it look like a buy right now compared to the market in Japan, where around half of the companies have P/E ratios above 14x and even P/E's above 21x are quite common. However, the P/E might be low for a reason and it requires further investigation to determine if it's justified.
Recent times have been quite advantageous for Access Group Holdings as its earnings have been rising very briskly. It might be that many expect the strong earnings performance to degrade substantially, which has repressed the P/E. If that doesn't eventuate, then existing shareholders have reason to be quite optimistic about the future direction of the share price.
Check out our latest analysis for Access Group Holdings
What Are Growth Metrics Telling Us About The Low P/E?
Access Group Holdings' P/E ratio would be typical for a company that's only expected to deliver limited growth, and importantly, perform worse than the market.
If we review the last year of earnings growth, the company posted a terrific increase of 81%. Still, EPS has barely risen at all from three years ago in total, which is not ideal. Therefore, it's fair to say that earnings growth has been inconsistent recently for the company.
Comparing that to the market, which is predicted to deliver 10% growth in the next 12 months, the company's momentum is weaker based on recent medium-term annualised earnings results.
With this information, we can see why Access Group Holdings is trading at a P/E lower than the market. Apparently many shareholders weren't comfortable holding on to something they believe will continue to trail the bourse.
The Final Word
Access Group Holdings' stock might have been given a solid boost, but its P/E certainly hasn't reached any great heights. While the price-to-earnings ratio shouldn't be the defining factor in whether you buy a stock or not, it's quite a capable barometer of earnings expectations.
As we suspected, our examination of Access Group Holdings revealed its three-year earnings trends are contributing to its low P/E, given they look worse than current market expectations. At this stage investors feel the potential for an improvement in earnings isn't great enough to justify a higher P/E ratio. If recent medium-term earnings trends continue, it's hard to see the share price rising strongly in the near future under these circumstances.
There are also other vital risk factors to consider before investing and we've discovered 2 warning signs for Access Group Holdings that you should be aware of.
You might be able to find a better investment than Access Group Holdings. If you want a selection of possible candidates, check out this free list of interesting companies that trade on a low P/E (but have proven they can grow earnings).
New: Manage All Your Stock Portfolios in One Place
We've created the ultimate portfolio companion for stock investors, and it's free.
• Connect an unlimited number of Portfolios and see your total in one currency
• Be alerted to new Warning Signs or Risks via email or mobile
• Track the Fair Value of your stocks
Have feedback on this article? Concerned about the content? Get in touch with us directly. Alternatively, email editorial-team (at) simplywallst.com.
This article by Simply Wall St is general in nature. We provide commentary based on historical data and analyst forecasts only using an unbiased methodology and our articles are not intended to be financial advice. It does not constitute a recommendation to buy or sell any stock, and does not take account of your objectives, or your financial situation. We aim to bring you long-term focused analysis driven by fundamental data. Note that our analysis may not factor in the latest price-sensitive company announcements or qualitative material. Simply Wall St has no position in any stocks mentioned.
About TSE:7042
Access Group Holdings
Engages in promotion, human resource recruitment public relations, and school public relations businesses.
Flawless balance sheet and good value.
Market Insights

Advertisement
Community Narratives
MicroVision will explode future revenue by 380.37% with a vision towards success
Fair Value US$60|98.4% undervalued
TH
Community Contributor
The Indispensable Artery for a New North American Economy
Fair Value CA$132.87|3.6% undervalued
TI
Community Contributor
Recently Updated Narratives
TI


TickerTickle on Oracle ·
The Quiet Giant That Became AI’s Power Grid
Fair Value:US$389.8148.6% undervalued
2 followersusers have followed this narrative
0 commentsusers have commented on this narrative
0 likesusers have liked this narrative
AU

AuCA on Nova Ljubljanska Banka d.d ·
Nova Ljubljanska Banka d.d will expect a 11.2% revenue boost driving future growth
Fair Value:€20916.0% undervalued
22 followersusers have followed this narrative
3 commentsusers have commented on this narrative
0 likesusers have liked this narrative
BI


BinocularMan on NVIDIA ·
The AI Infrastructure Giant Grows Into Its Valuation
Fair Value:US$345.0747.1% undervalued
2 followersusers have followed this narrative
0 commentsusers have commented on this narrative
0 likesusers have liked this narrative
Popular Narratives
OS


oscargarcia on Alphabet ·
The company that turned a verb into a global necessity and basically runs the modern internet, digital ads, smartphones, maps, and AI.
Fair Value:US$3406.3% undervalued
128 followersusers have followed this narrative
5 commentsusers have commented on this narrative
17 likesusers have liked this narrative
TH

TheWallstreetKing on MicroVision ·
MicroVision will explode future revenue by 380.37% with a vision towards success
Fair Value:US$6098.4% undervalued
79 followersusers have followed this narrative
10 commentsusers have commented on this narrative
16 likesusers have liked this narrative
AN

AnalystConsensusTarget on NVIDIA ·
NVDA: Expanding AI Demand Will Drive Major Data Center Investments Through 2026
Fair Value:US$232.7921.6% undervalued
915 followersusers have followed this narrative
5 commentsusers have commented on this narrative
21 likesusers have liked this narrative