
Advertisement
eMnet Japan.co.ltd (TSE:7036) May Have Issues Allocating Its Capital
If we want to find a stock that could multiply over the long term, what are the underlying trends we should look for? In a perfect world, we'd like to see a company investing more capital into its business and ideally the returns earned from that capital are also increasing. This shows us that it's a compounding machine, able to continually reinvest its earnings back into the business and generate higher returns. However, after investigating eMnet Japan.co.ltd (TSE:7036), we don't think it's current trends fit the mold of a multi-bagger.
Return On Capital Employed (ROCE): What Is It?
Just to clarify if you're unsure, ROCE is a metric for evaluating how much pre-tax income (in percentage terms) a company earns on the capital invested in its business. To calculate this metric for eMnet Japan.co.ltd, this is the formula:
Return on Capital Employed = Earnings Before Interest and Tax (EBIT) ÷ (Total Assets - Current Liabilities)
0.036 = JP¥58m ÷ (JP¥2.7b - JP¥1.1b) (Based on the trailing twelve months to June 2024).
So, eMnet Japan.co.ltd has an ROCE of 3.6%. In absolute terms, that's a low return and it also under-performs the Media industry average of 9.8%.
Check out our latest analysis for eMnet Japan.co.ltd
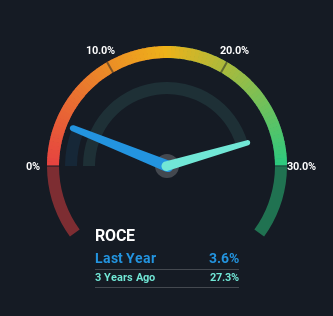
Historical performance is a great place to start when researching a stock so above you can see the gauge for eMnet Japan.co.ltd's ROCE against it's prior returns. If you'd like to look at how eMnet Japan.co.ltd has performed in the past in other metrics, you can view this free graph of eMnet Japan.co.ltd's past earnings, revenue and cash flow.
So How Is eMnet Japan.co.ltd's ROCE Trending?
On the surface, the trend of ROCE at eMnet Japan.co.ltd doesn't inspire confidence. To be more specific, ROCE has fallen from 31% over the last five years. However it looks like eMnet Japan.co.ltd might be reinvesting for long term growth because while capital employed has increased, the company's sales haven't changed much in the last 12 months. It may take some time before the company starts to see any change in earnings from these investments.
On a related note, eMnet Japan.co.ltd has decreased its current liabilities to 41% of total assets. So we could link some of this to the decrease in ROCE. Effectively this means their suppliers or short-term creditors are funding less of the business, which reduces some elements of risk. Since the business is basically funding more of its operations with it's own money, you could argue this has made the business less efficient at generating ROCE. Either way, they're still at a pretty high level, so we'd like to see them fall further if possible.
The Bottom Line On eMnet Japan.co.ltd's ROCE
To conclude, we've found that eMnet Japan.co.ltd is reinvesting in the business, but returns have been falling. Since the stock has declined 35% over the last five years, investors may not be too optimistic on this trend improving either. In any case, the stock doesn't have these traits of a multi-bagger discussed above, so if that's what you're looking for, we think you'd have more luck elsewhere.
One final note, you should learn about the 4 warning signs we've spotted with eMnet Japan.co.ltd (including 2 which shouldn't be ignored) .
While eMnet Japan.co.ltd isn't earning the highest return, check out this free list of companies that are earning high returns on equity with solid balance sheets.
New: Manage All Your Stock Portfolios in One Place
We've created the ultimate portfolio companion for stock investors, and it's free.
• Connect an unlimited number of Portfolios and see your total in one currency
• Be alerted to new Warning Signs or Risks via email or mobile
• Track the Fair Value of your stocks
Have feedback on this article? Concerned about the content? Get in touch with us directly. Alternatively, email editorial-team (at) simplywallst.com.
This article by Simply Wall St is general in nature. We provide commentary based on historical data and analyst forecasts only using an unbiased methodology and our articles are not intended to be financial advice. It does not constitute a recommendation to buy or sell any stock, and does not take account of your objectives, or your financial situation. We aim to bring you long-term focused analysis driven by fundamental data. Note that our analysis may not factor in the latest price-sensitive company announcements or qualitative material. Simply Wall St has no position in any stocks mentioned.
About TSE:7036
Flawless balance sheet with proven track record.
Market Insights

Advertisement
Community Narratives
MicroVision will explode future revenue by 380.37% with a vision towards success
Fair Value US$60|98.4% undervalued
TH
Community Contributor
The Indispensable Artery for a New North American Economy
Fair Value CA$132.87|1.6% undervalued
TI
Community Contributor
Recently Updated Narratives
BE


Bejgal on MINISO Group Holding ·
MINISO's fair value is projected at 26.69 with an anticipated PE ratio shift of 20x
Fair Value:US$26.6928.0% undervalued
44 followersusers have followed this narrative
3 commentsusers have commented on this narrative
0 likesusers have liked this narrative
TI


TickerTickle on Oracle ·
The Quiet Giant That Became AI’s Power Grid
Fair Value:US$389.8149.5% undervalued
6 followersusers have followed this narrative
0 commentsusers have commented on this narrative
0 likesusers have liked this narrative
AU

AuCA on Nova Ljubljanska Banka d.d ·
Nova Ljubljanska Banka d.d will expect a 11.2% revenue boost driving future growth
Fair Value:€20916.3% undervalued
23 followersusers have followed this narrative
3 commentsusers have commented on this narrative
0 likesusers have liked this narrative
Popular Narratives
OS


oscargarcia on Alphabet ·
The company that turned a verb into a global necessity and basically runs the modern internet, digital ads, smartphones, maps, and AI.
Fair Value:US$3404.9% undervalued
134 followersusers have followed this narrative
6 commentsusers have commented on this narrative
18 likesusers have liked this narrative
TH

TheWallstreetKing on MicroVision ·
MicroVision will explode future revenue by 380.37% with a vision towards success
Fair Value:US$6098.4% undervalued
82 followersusers have followed this narrative
10 commentsusers have commented on this narrative
18 likesusers have liked this narrative
AN


AnalystConsensusTarget on NVIDIA ·
NVDA: Expanding AI Demand Will Drive Major Data Center Investments Through 2026
Fair Value:US$232.7923.6% undervalued
919 followersusers have followed this narrative
5 commentsusers have commented on this narrative
21 likesusers have liked this narrative